Files
import {
  ArrowDownRight,
  ArrowUpRight,
} from "@designali/icons"

import { CounterNumber } from "@/components/ui/counter-number"

const stats = [
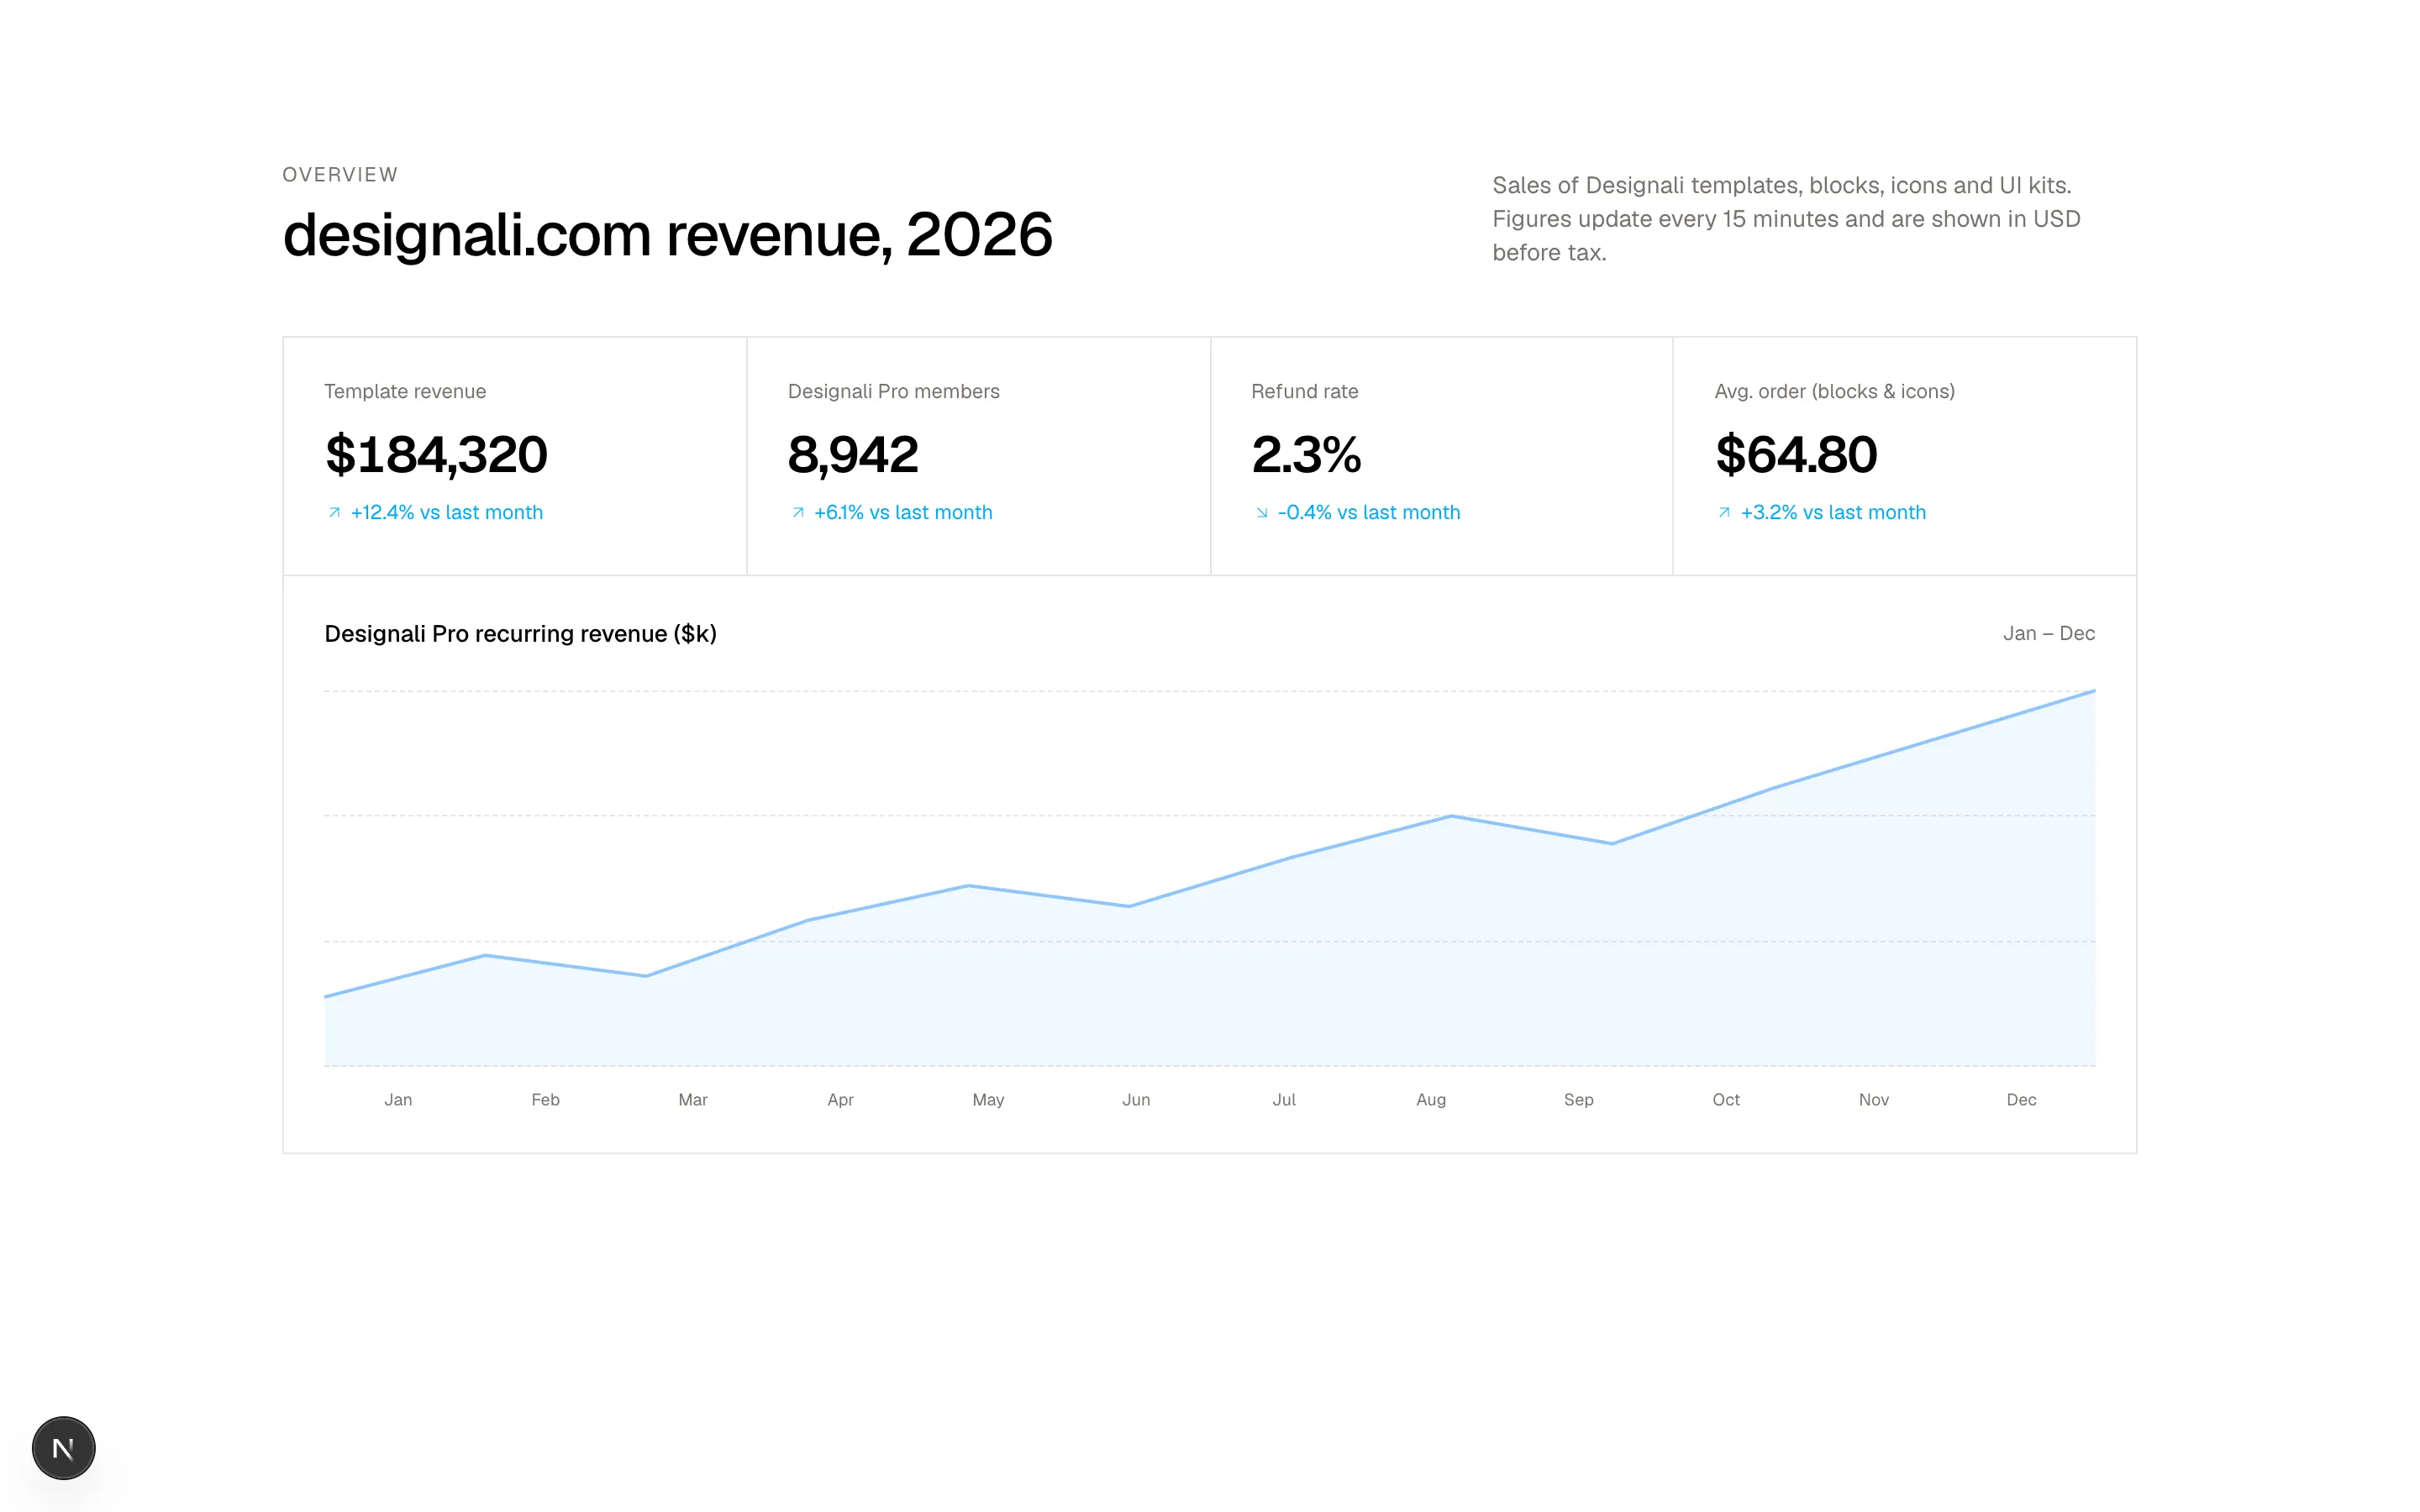
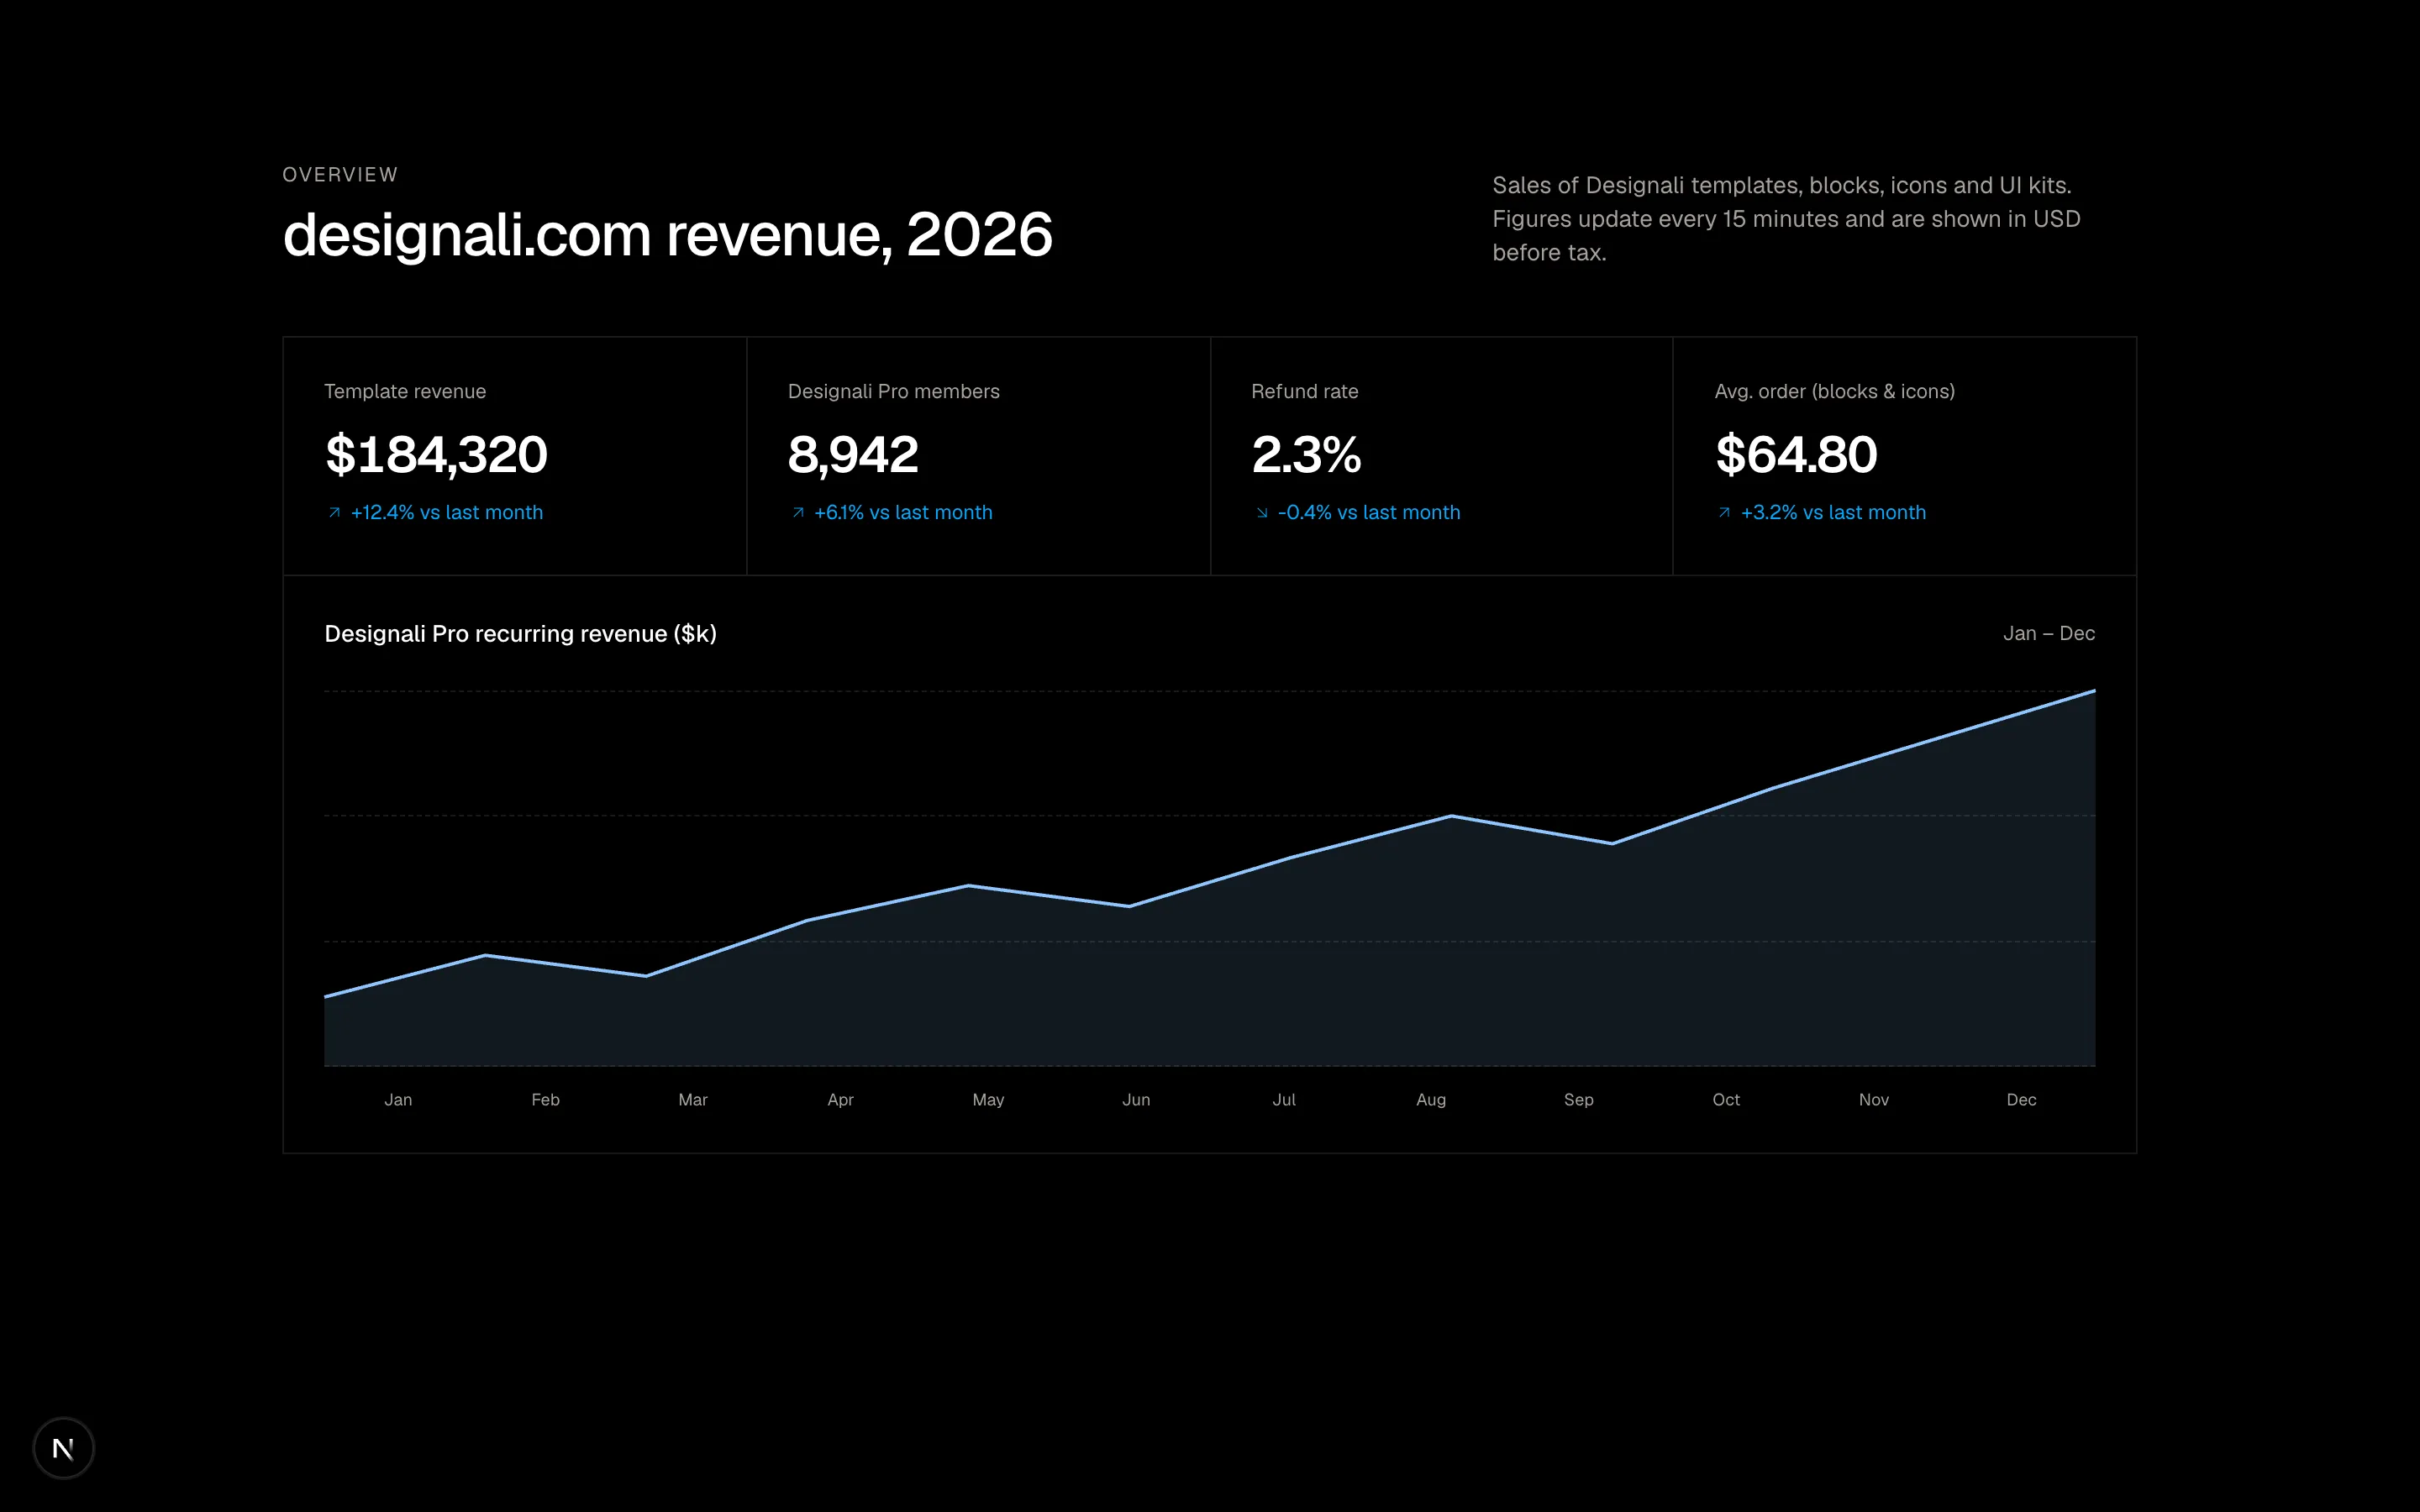
  { label: "Template revenue", value: 184320, prefix: "$", suffix: "", decimals: 0, change: "+12.4%", up: true },
  { label: "Designali Pro members", value: 8942, prefix: "", suffix: "", decimals: 0, change: "+6.1%", up: true },
  { label: "Refund rate", value: 2.3, prefix: "", suffix: "%", decimals: 1, change: "-0.4%", up: false },
  { label: "Avg. order (blocks & icons)", value: 64.8, prefix: "$", suffix: "", decimals: 2, change: "+3.2%", up: true },
]

const revenue = [42, 48, 45, 53, 58, 55, 62, 68, 64, 72, 79, 86]
const months = ["Jan", "Feb", "Mar", "Apr", "May", "Jun", "Jul", "Aug", "Sep", "Oct", "Nov", "Dec"]

export function Analytics01() {
  const max = Math.max(...revenue)
  const min = Math.min(...revenue) - 10
  const points = revenue
    .map((v, i) => {
      const x = (i / (revenue.length - 1)) * 100
      const y = 100 - ((v - min) / (max - min)) * 100
      return `${x},${y}`
    })
    .join(" ")

  return (
    <section className="w-full bg-background py-16 text-foreground md:py-24">
      <div className="mx-auto max-w-6xl px-6">
        <div className="mb-10 flex flex-col justify-between gap-4 md:flex-row md:items-end">
          <div>
            <p className="text-xs tracking-widest text-muted-foreground uppercase">
              Overview
            </p>
            <h2 className="mt-2 text-3xl font-medium tracking-tight md:text-4xl">
              designali.com revenue, 2026
            </h2>
          </div>
          <p className="max-w-sm text-sm text-muted-foreground">
            Sales of Designali templates, blocks, icons and UI kits. Figures
            update every 15 minutes and are shown in USD before tax.
          </p>
        </div>

        <div className="grid grid-cols-2 border-t border-l border-border lg:grid-cols-4">
          {stats.map((stat) => (
            <div key={stat.label} className="border-r border-b border-border p-6">
              <p className="text-xs text-muted-foreground">{stat.label}</p>
              <CounterNumber
                value={stat.value}
                prefix={stat.prefix}
                suffix={stat.suffix}
                decimalPlaces={stat.decimals}
                className="mt-3 block text-2xl font-semibold tracking-tight md:text-3xl"
              />
              <p
                className={`mt-2 inline-flex items-center gap-1 text-xs ${
                  stat.up ? "text-primary dark:text-primary" : "text-primary dark:text-primary"
                }`}
              >
                {stat.up ? (
                  <ArrowUpRight className="size-3" />
                ) : (
                  <ArrowDownRight className="size-3" />
                )}
                {stat.change} vs last month
              </p>
            </div>
          ))}
        </div>

        <div className="border-x border-b border-border p-6">
          <div className="mb-6 flex items-center justify-between">
            <p className="text-sm font-medium">Designali Pro recurring revenue ($k)</p>
            <span className="text-xs text-muted-foreground">Jan – Dec</span>
          </div>
          <div className="relative h-56 w-full">
            <div className="absolute inset-0 flex flex-col justify-between">
              {[0, 1, 2, 3].map((line) => (
                <div key={line} className="border-t border-dashed border-border" />
              ))}
            </div>
            <svg
              viewBox="0 0 100 100"
              preserveAspectRatio="none"
              className="absolute inset-0 h-full w-full overflow-visible"
            >
              <polygon
                points={`0,100 ${points} 100,100`}
                fill="var(--chart-1)"
                opacity="0.12"
              />
              <polyline
                points={points}
                fill="none"
                stroke="var(--chart-1)"
                strokeWidth="2"
                vectorEffect="non-scaling-stroke"
              />
            </svg>
          </div>
          <div className="mt-3 grid grid-cols-12 text-center text-[10px] text-muted-foreground">
            {months.map((month) => (
              <span key={month}>{month}</span>
            ))}
          </div>
        </div>
      </div>
    </section>
  )
}
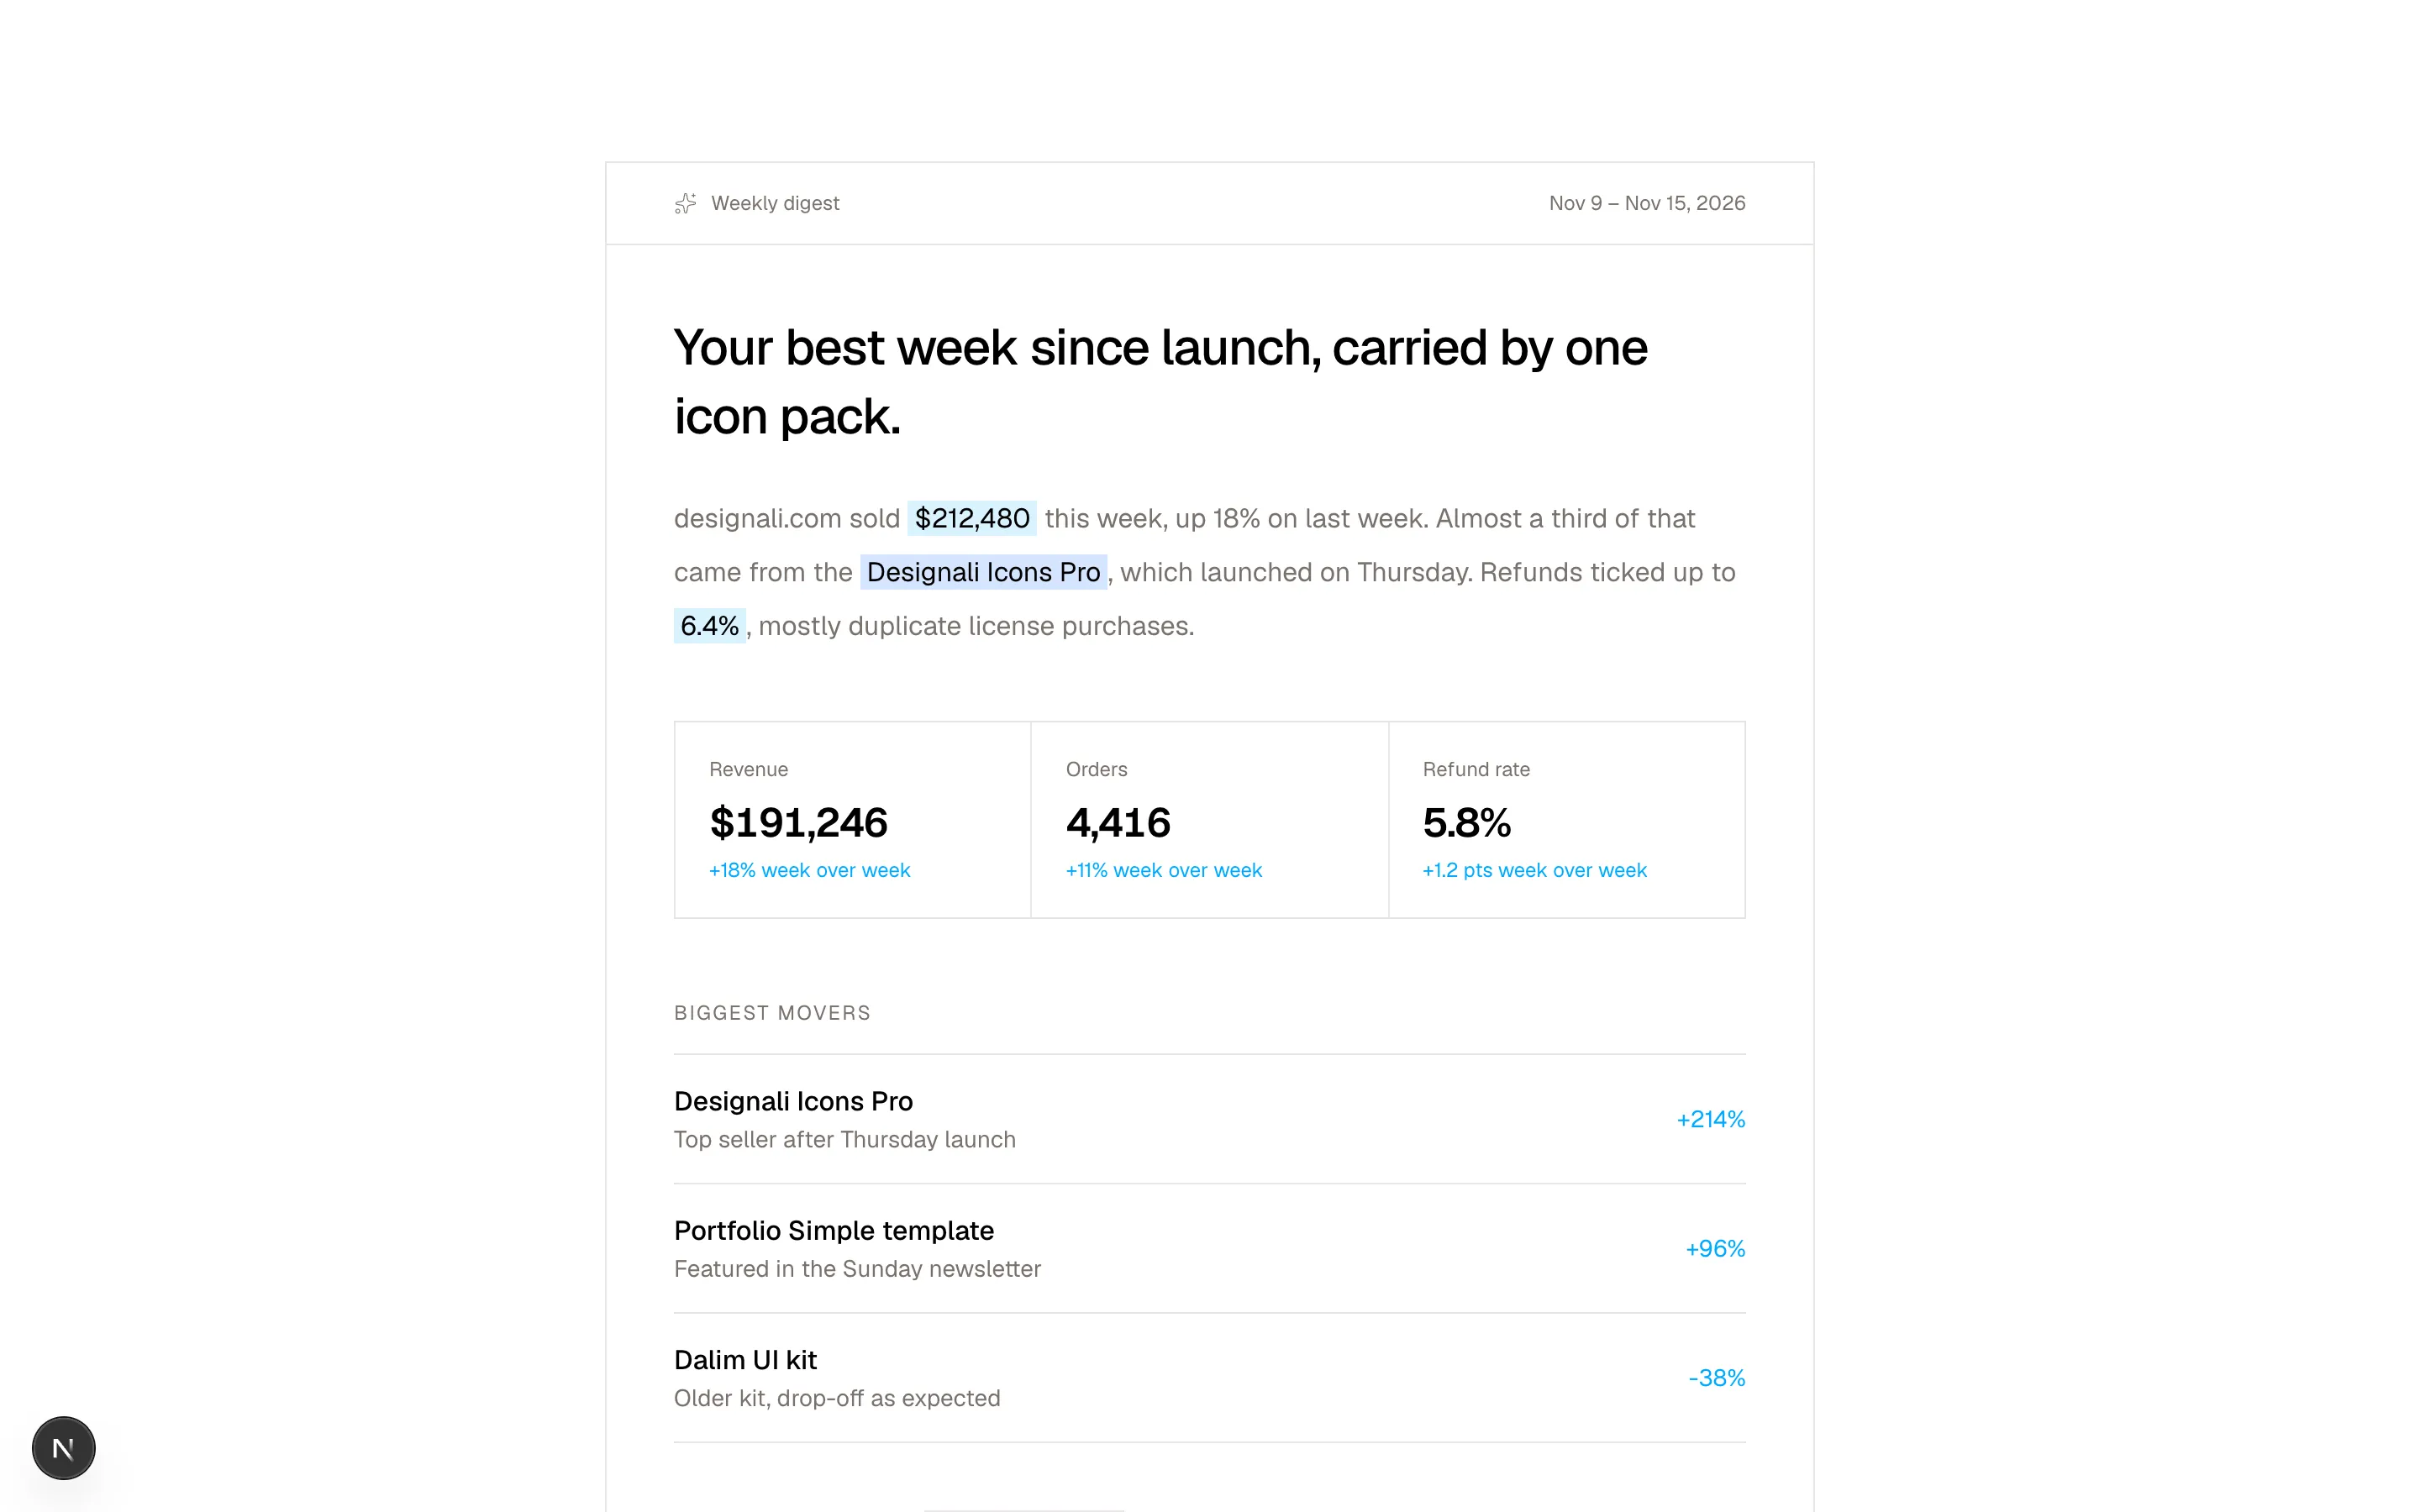
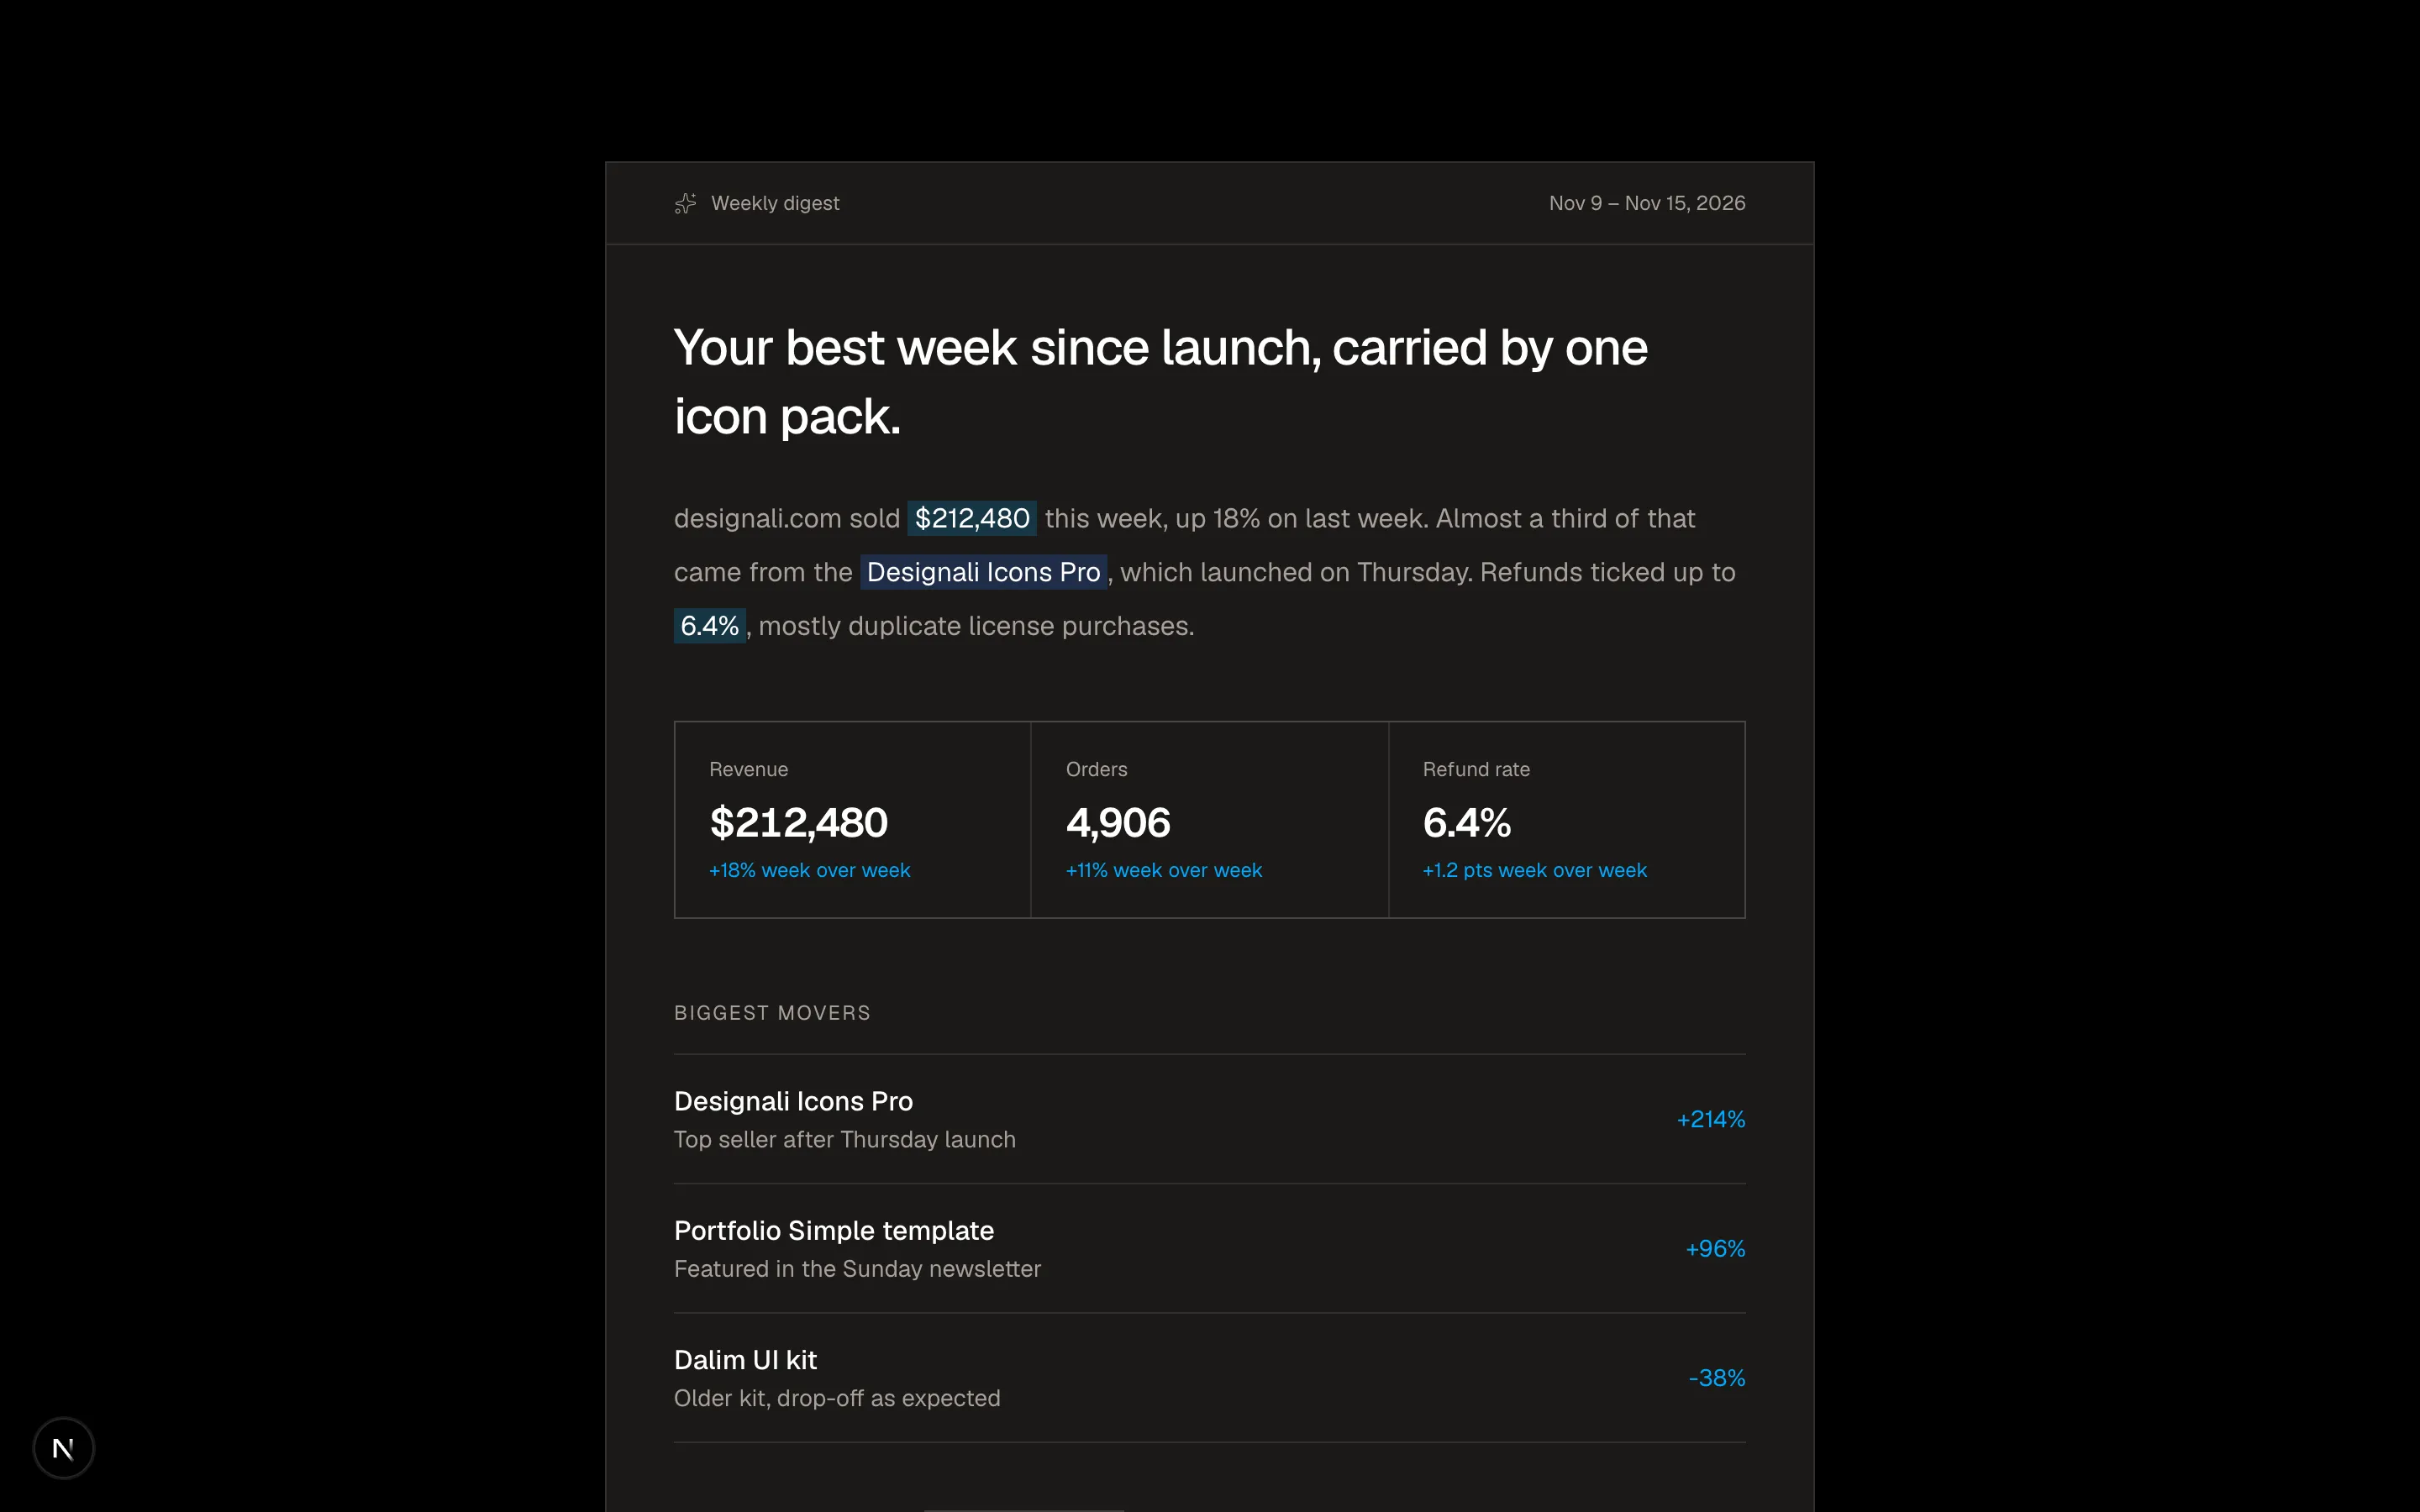
A revenue performance overview with KPI tiles and a line chart.
analytics-01
Files
"use client"

import { useState } from "react"

import { cn } from "@/lib/utils"

import { CounterNumber } from "@/components/ui/counter-number"

const ranges = {
  "7d": [320, 410, 380, 460, 520, 490, 610],
  "30d": [280, 340, 390, 360, 420, 470, 450, 510, 560, 530, 590, 640, 620, 680],
  "90d": [210, 260, 300, 340, 330, 380, 420, 460, 440, 500, 540, 580],
} as const

type Range = keyof typeof ranges

const sources = [
  { name: "Google search", share: 42, color: "var(--chart-1)" },
  { name: "Direct", share: 24, color: "var(--chart-2)" },
  { name: "21st.dev", share: 18, color: "var(--chart-3)" },
  { name: "Instagram & X", share: 11, color: "var(--chart-4)" },
  { name: "Newsletter", share: 5, color: "var(--chart-5)" },
]

export function Analytics02() {
  const [range, setRange] = useState<Range>("30d")
  const data = ranges[range]
  const max = Math.max(...data)
  const total = data.reduce((sum, v) => sum + v, 0)

  return (
    <section className="w-full bg-muted/40 px-6 py-16 text-foreground md:py-24">
      <div className="mx-auto grid max-w-6xl gap-px border border-border bg-border lg:grid-cols-3">
        <div className="bg-background p-6 md:p-8 lg:col-span-2">
          <div className="flex flex-wrap items-start justify-between gap-4">
            <div>
              <p className="text-xs text-muted-foreground">Unique visitors on designali.com</p>
              <CounterNumber
                value={total}
                className="mt-1 block text-4xl font-semibold tracking-tight"
              />
            </div>
            <div className="flex border border-border">
              {(Object.keys(ranges) as Range[]).map((key) => (
                <button
                  key={key}
                  type="button"
                  onClick={() => setRange(key)}
                  className={cn(
                    "px-3 py-1.5 text-xs transition-colors not-last:border-r not-last:border-border",
                    range === key
                      ? "bg-foreground text-background"
                      : "text-muted-foreground hover:bg-muted"
                  )}
                >
                  {key}
                </button>
              ))}
            </div>
          </div>

          <div className="mt-10 flex h-64 items-end gap-1.5 md:gap-2">
            {data.map((value, i) => (
              <div key={i} className="group relative flex h-full flex-1 items-end">
                <div
                  className="w-full bg-primary/80 transition-colors group-hover:bg-primary"
                  style={{ height: `${(value / max) * 100}%` }}
                />
                <span className="pointer-events-none absolute -top-6 left-1/2 -translate-x-1/2 border border-border bg-background px-1.5 py-0.5 text-[10px] opacity-0 transition-opacity group-hover:opacity-100">
                  {value}
                </span>
              </div>
            ))}
          </div>
          <div className="mt-2 border-t border-border pt-2 text-[10px] text-muted-foreground">
            Hover a bar to see daily totals
          </div>
        </div>

        <div className="bg-background p-6 md:p-8">
          <p className="text-sm font-medium">Where visitors come from</p>
          <div className="mt-6 flex h-3 w-full">
            {sources.map((source) => (
              <div
                key={source.name}
                style={{ width: `${source.share}%`, background: source.color }}
              />
            ))}
          </div>
          <ul className="mt-8 divide-y divide-border">
            {sources.map((source) => (
              <li key={source.name} className="flex items-center justify-between py-3 text-sm">
                <span className="flex items-center gap-2">
                  <span className="size-2.5" style={{ background: source.color }} />
                  {source.name}
                </span>
                <span className="font-sans text-muted-foreground">{source.share}%</span>
              </li>
            ))}
          </ul>
        </div>
      </div>
    </section>
  )
}
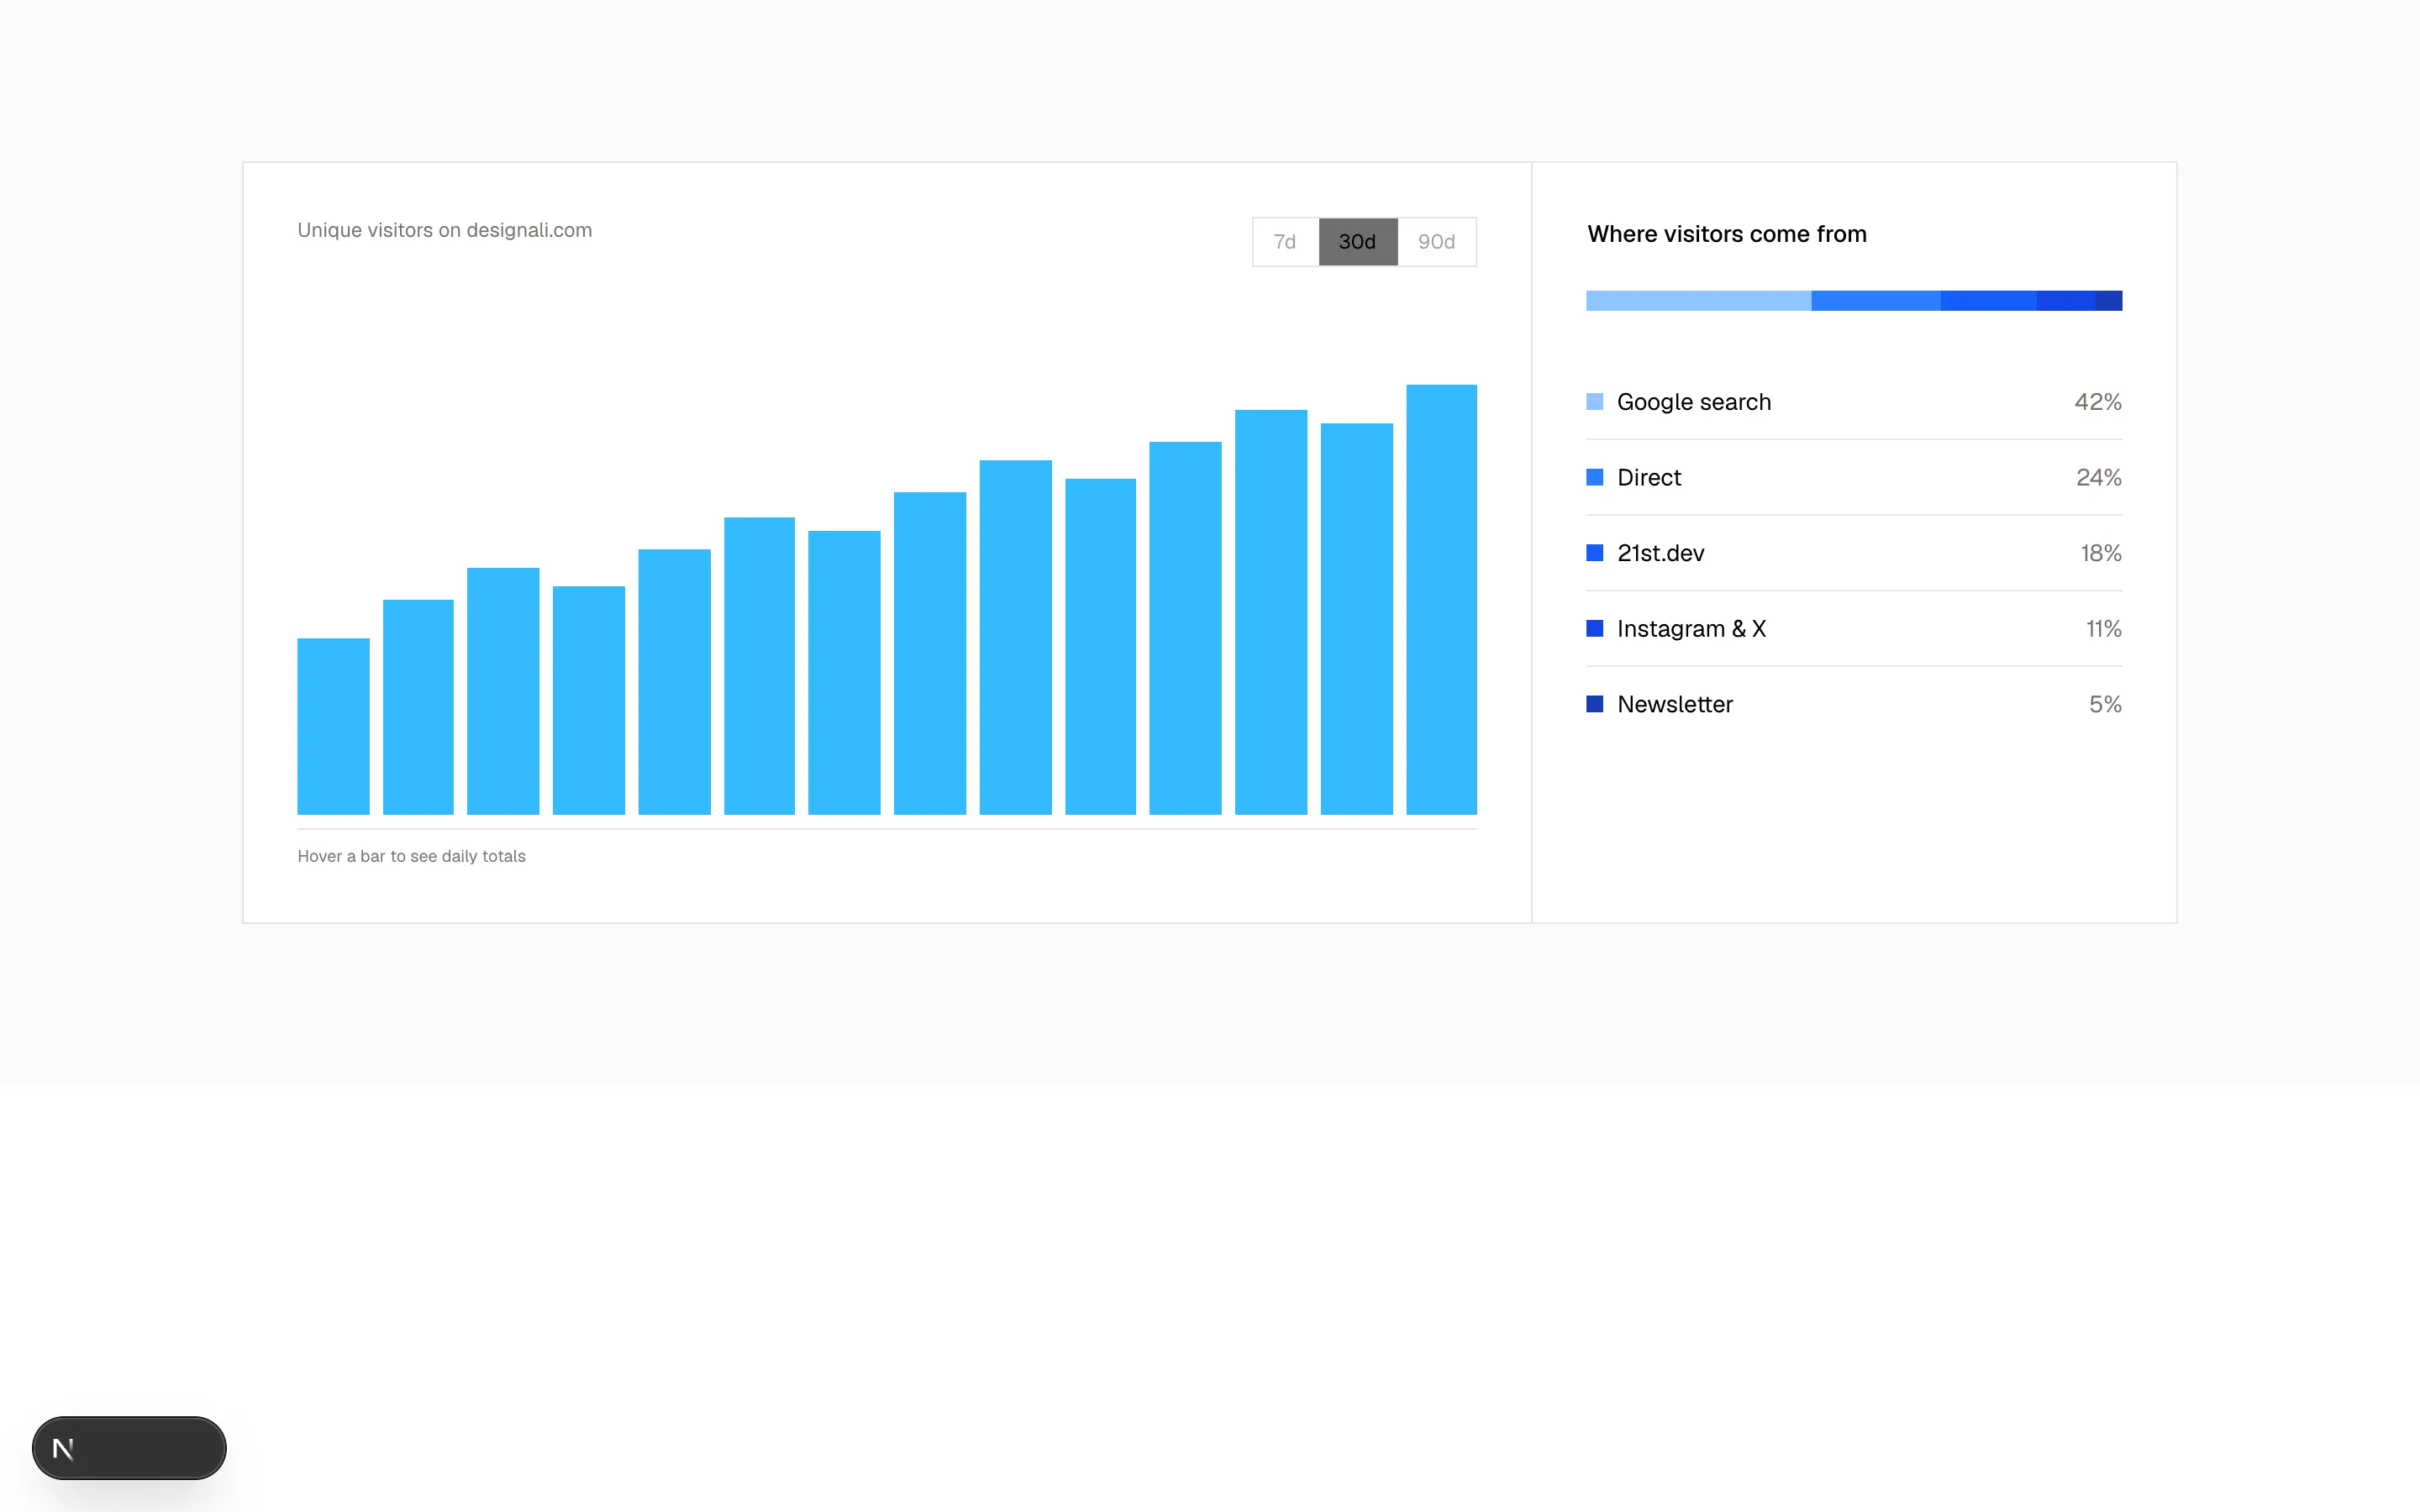
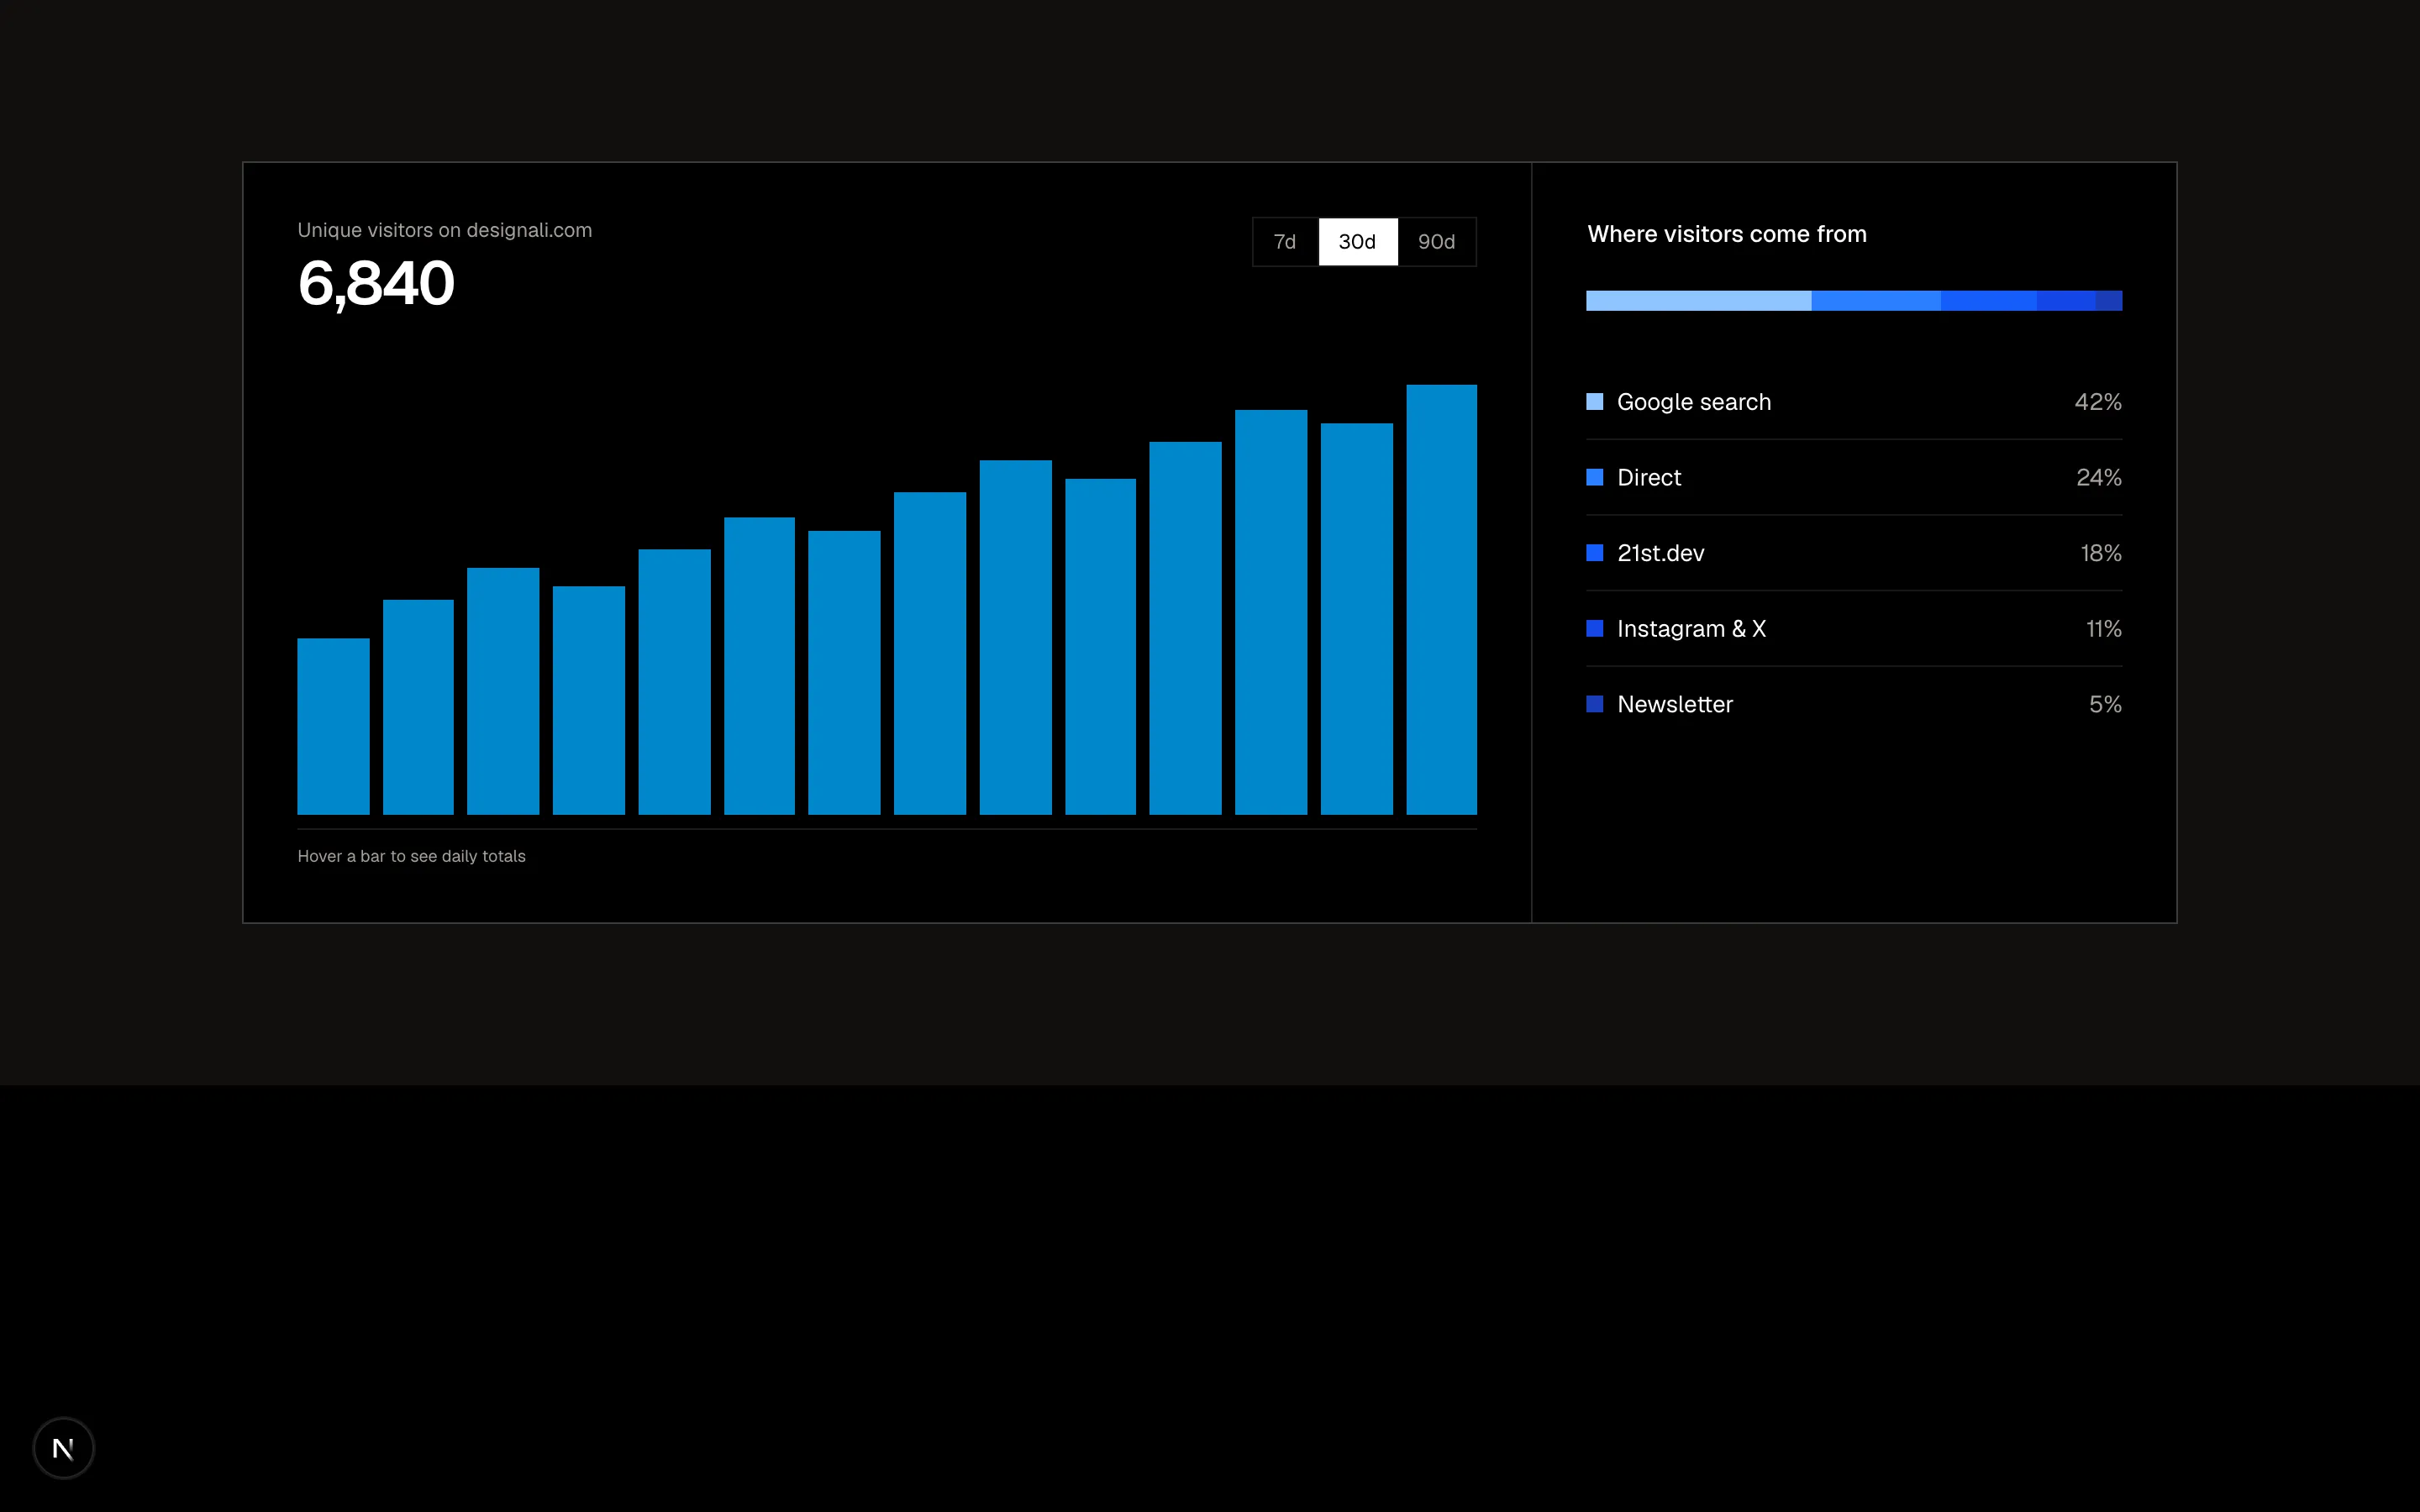
A traffic sources breakdown with switchable ranges and bar meters.
analytics-02
Files
import { CounterNumber } from "@/components/ui/counter-number"

const metrics = [
  { value: 99.98, decimals: 2, suffix: "%", label: "Uptime for designali.com on Vercel", detail: "Last 90 days" },
  { value: 38, decimals: 0, suffix: "ms", label: "Median page response time", detail: "p50, global edge" },
  { value: 1.2, decimals: 1, suffix: "M", label: "Icon & block downloads this month", detail: "Up 18% MoM" },
]

const goals = [
  { name: "Blocks published (460 target)", current: 78, target: 85 },
  { name: "Icons added to @designali/icons", current: 64, target: 70 },
  { name: "Client tickets resolved < 24h", current: 91, target: 90 },
  { name: "Designali Pro upgrades", current: 42, target: 60 },
]

export function Analytics03() {
  return (
    <section className="w-full bg-background py-16 text-foreground md:py-28">
      <div className="mx-auto max-w-5xl px-6">
        <h2 className="max-w-2xl text-3xl font-medium tracking-tight md:text-5xl">
          designali, measured in public,{" "}
          <span className="text-muted-foreground">design se code tak.</span>
        </h2>

        <div className="mt-14 grid divide-y divide-border border-y border-border md:grid-cols-3 md:divide-x md:divide-y-0">
          {metrics.map((metric) => (
            <div key={metric.label} className="py-8 md:px-8 md:first:pl-0">
              <CounterNumber
                value={metric.value}
                decimalPlaces={metric.decimals}
                suffix={metric.suffix}
                className="block text-5xl font-light tracking-tighter md:text-6xl"
              />
              <p className="mt-4 text-sm">{metric.label}</p>
              <p className="mt-1 text-xs text-muted-foreground">{metric.detail}</p>
            </div>
          ))}
        </div>

        <div className="mt-16">
          <div className="mb-6 flex items-baseline justify-between">
            <h3 className="text-lg font-medium">Studio goals this quarter</h3>
            <span className="text-xs text-muted-foreground">Updated Nov 14</span>
          </div>
          <div className="space-y-6">
            {goals.map((goal) => {
              const reached = goal.current >= goal.target
              return (
                <div key={goal.name}>
                  <div className="mb-2 flex items-center justify-between text-sm">
                    <span>{goal.name}</span>
                    <span className="font-sans text-xs text-muted-foreground">
                      {goal.current}% / {goal.target}%
                    </span>
                  </div>
                  <div className="relative h-2 w-full bg-muted">
                    <div
                      className={reached ? "h-full bg-primary" : "h-full bg-primary"}
                      style={{ width: `${goal.current}%` }}
                    />
                    <div
                      className="absolute -top-1 h-4 w-px bg-foreground"
                      style={{ left: `${goal.target}%` }}
                    />
                  </div>
                </div>
              )
            })}
          </div>
        </div>
      </div>
    </section>
  )
}
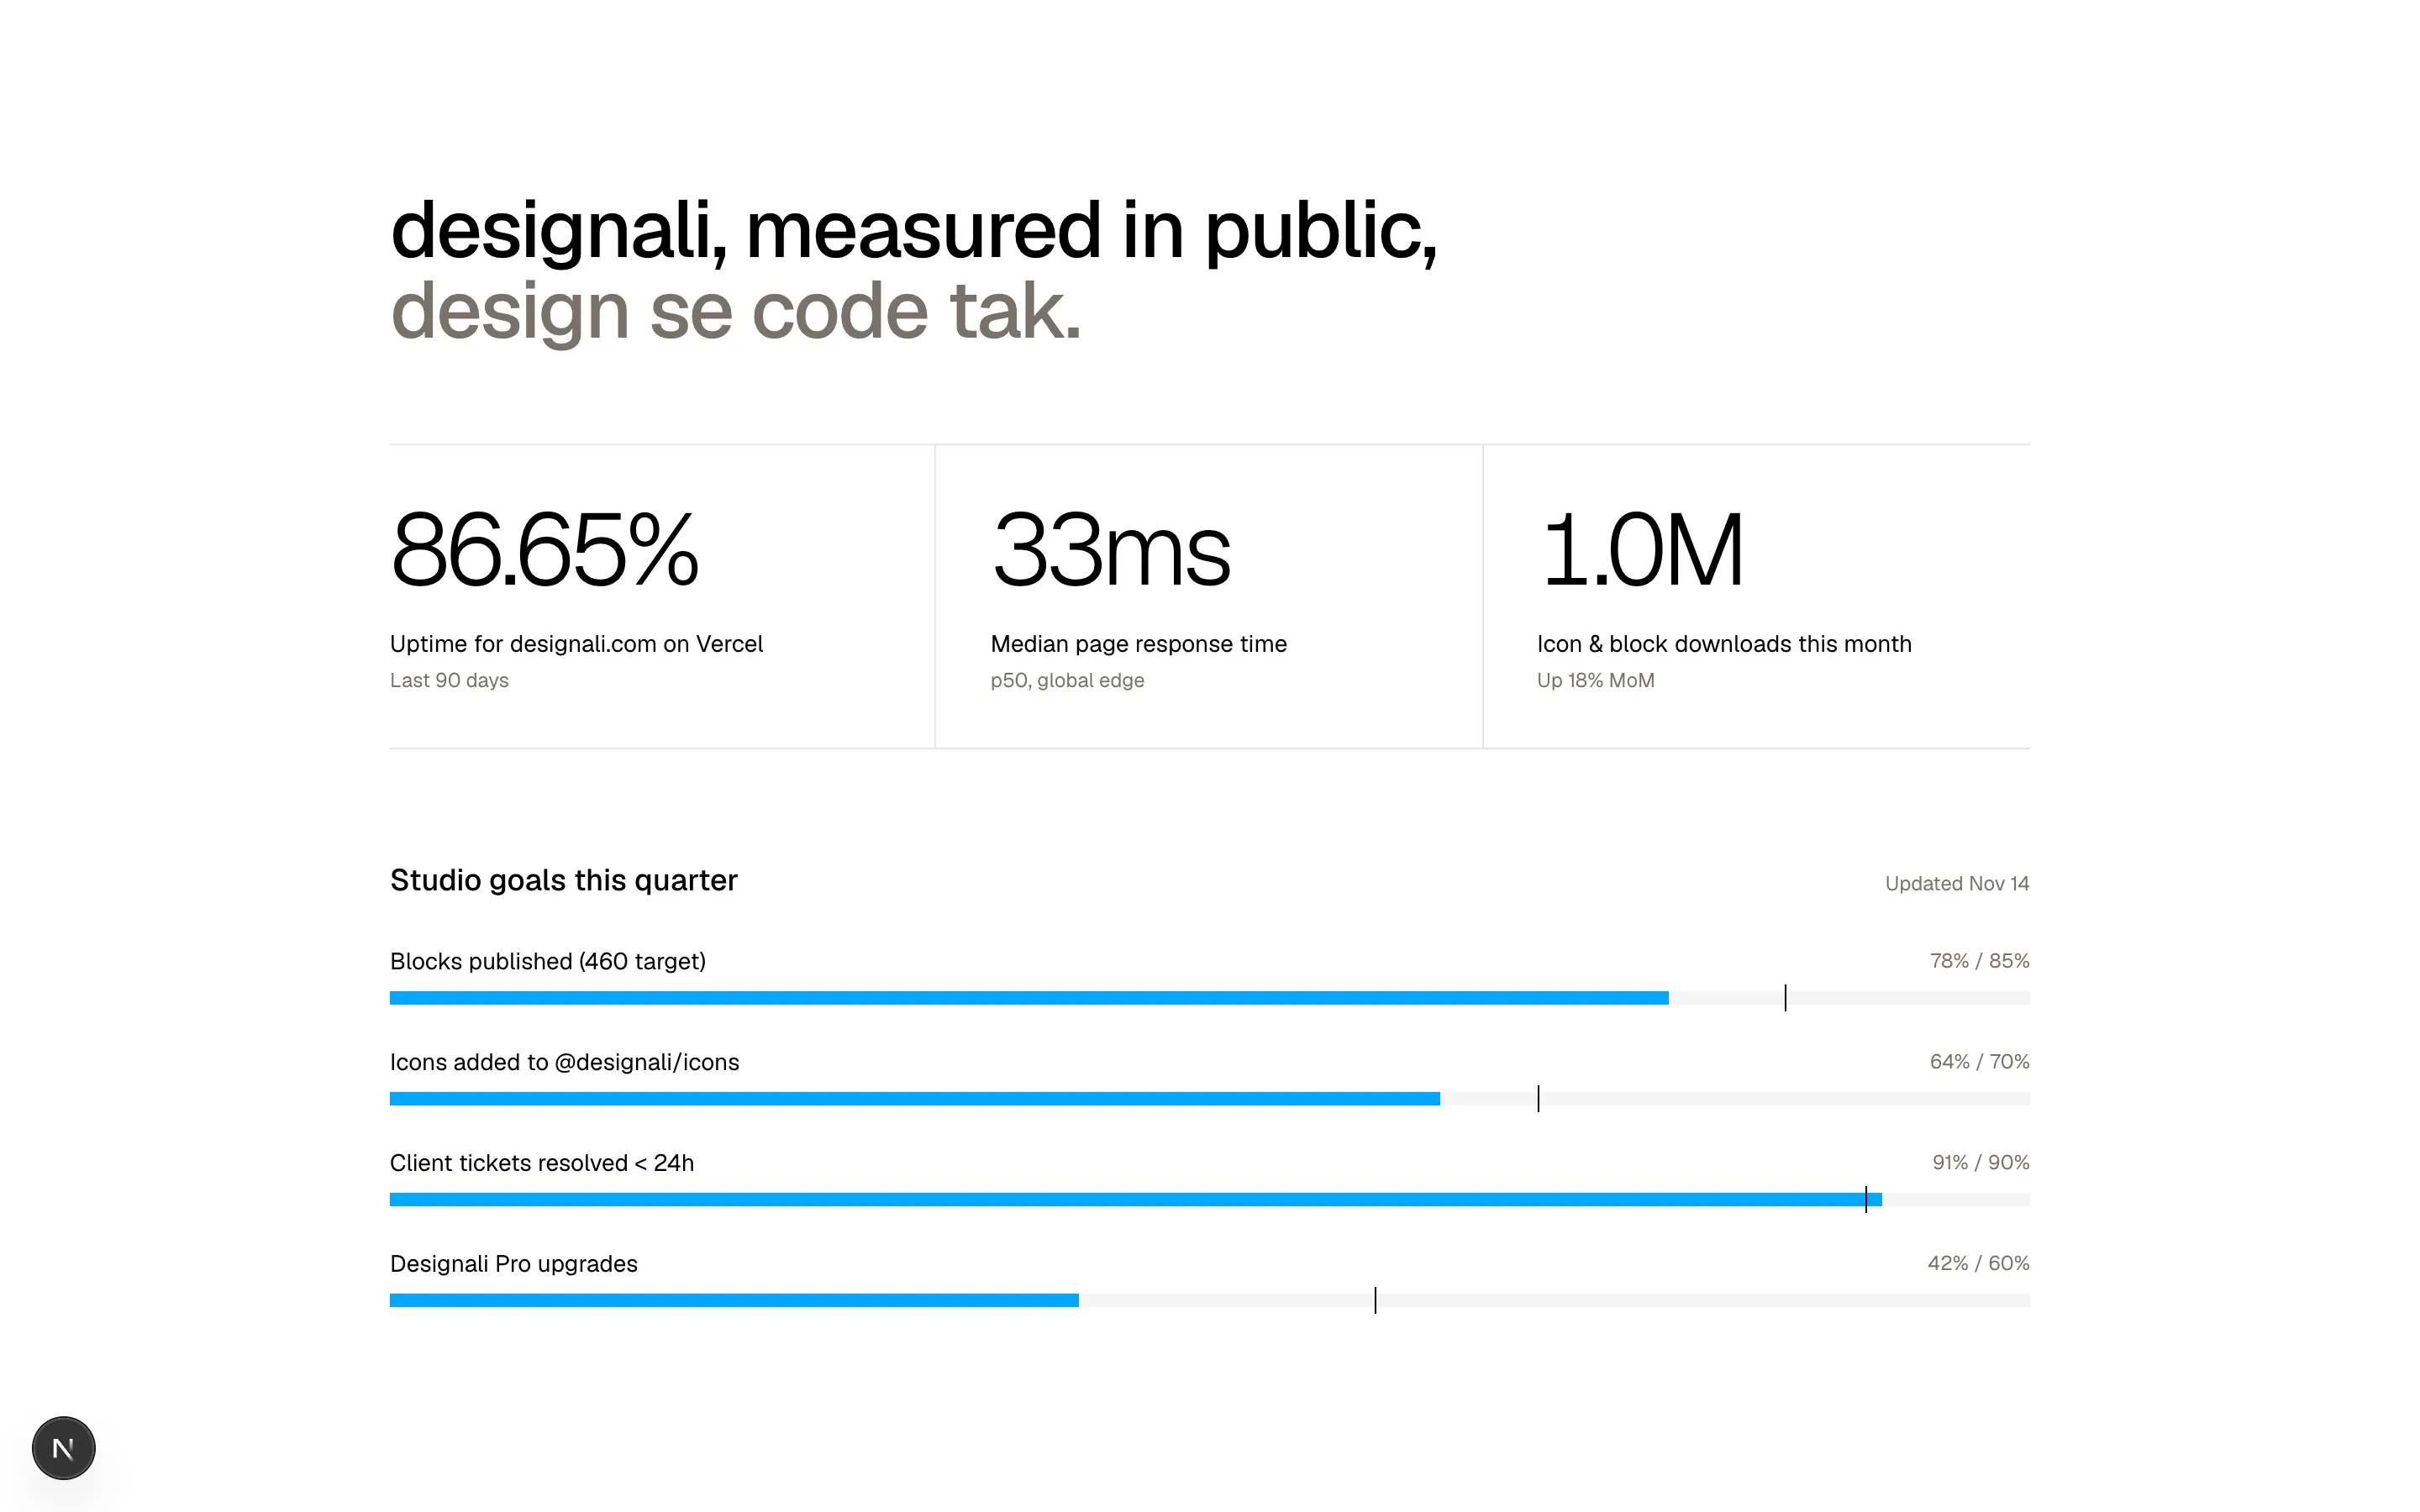
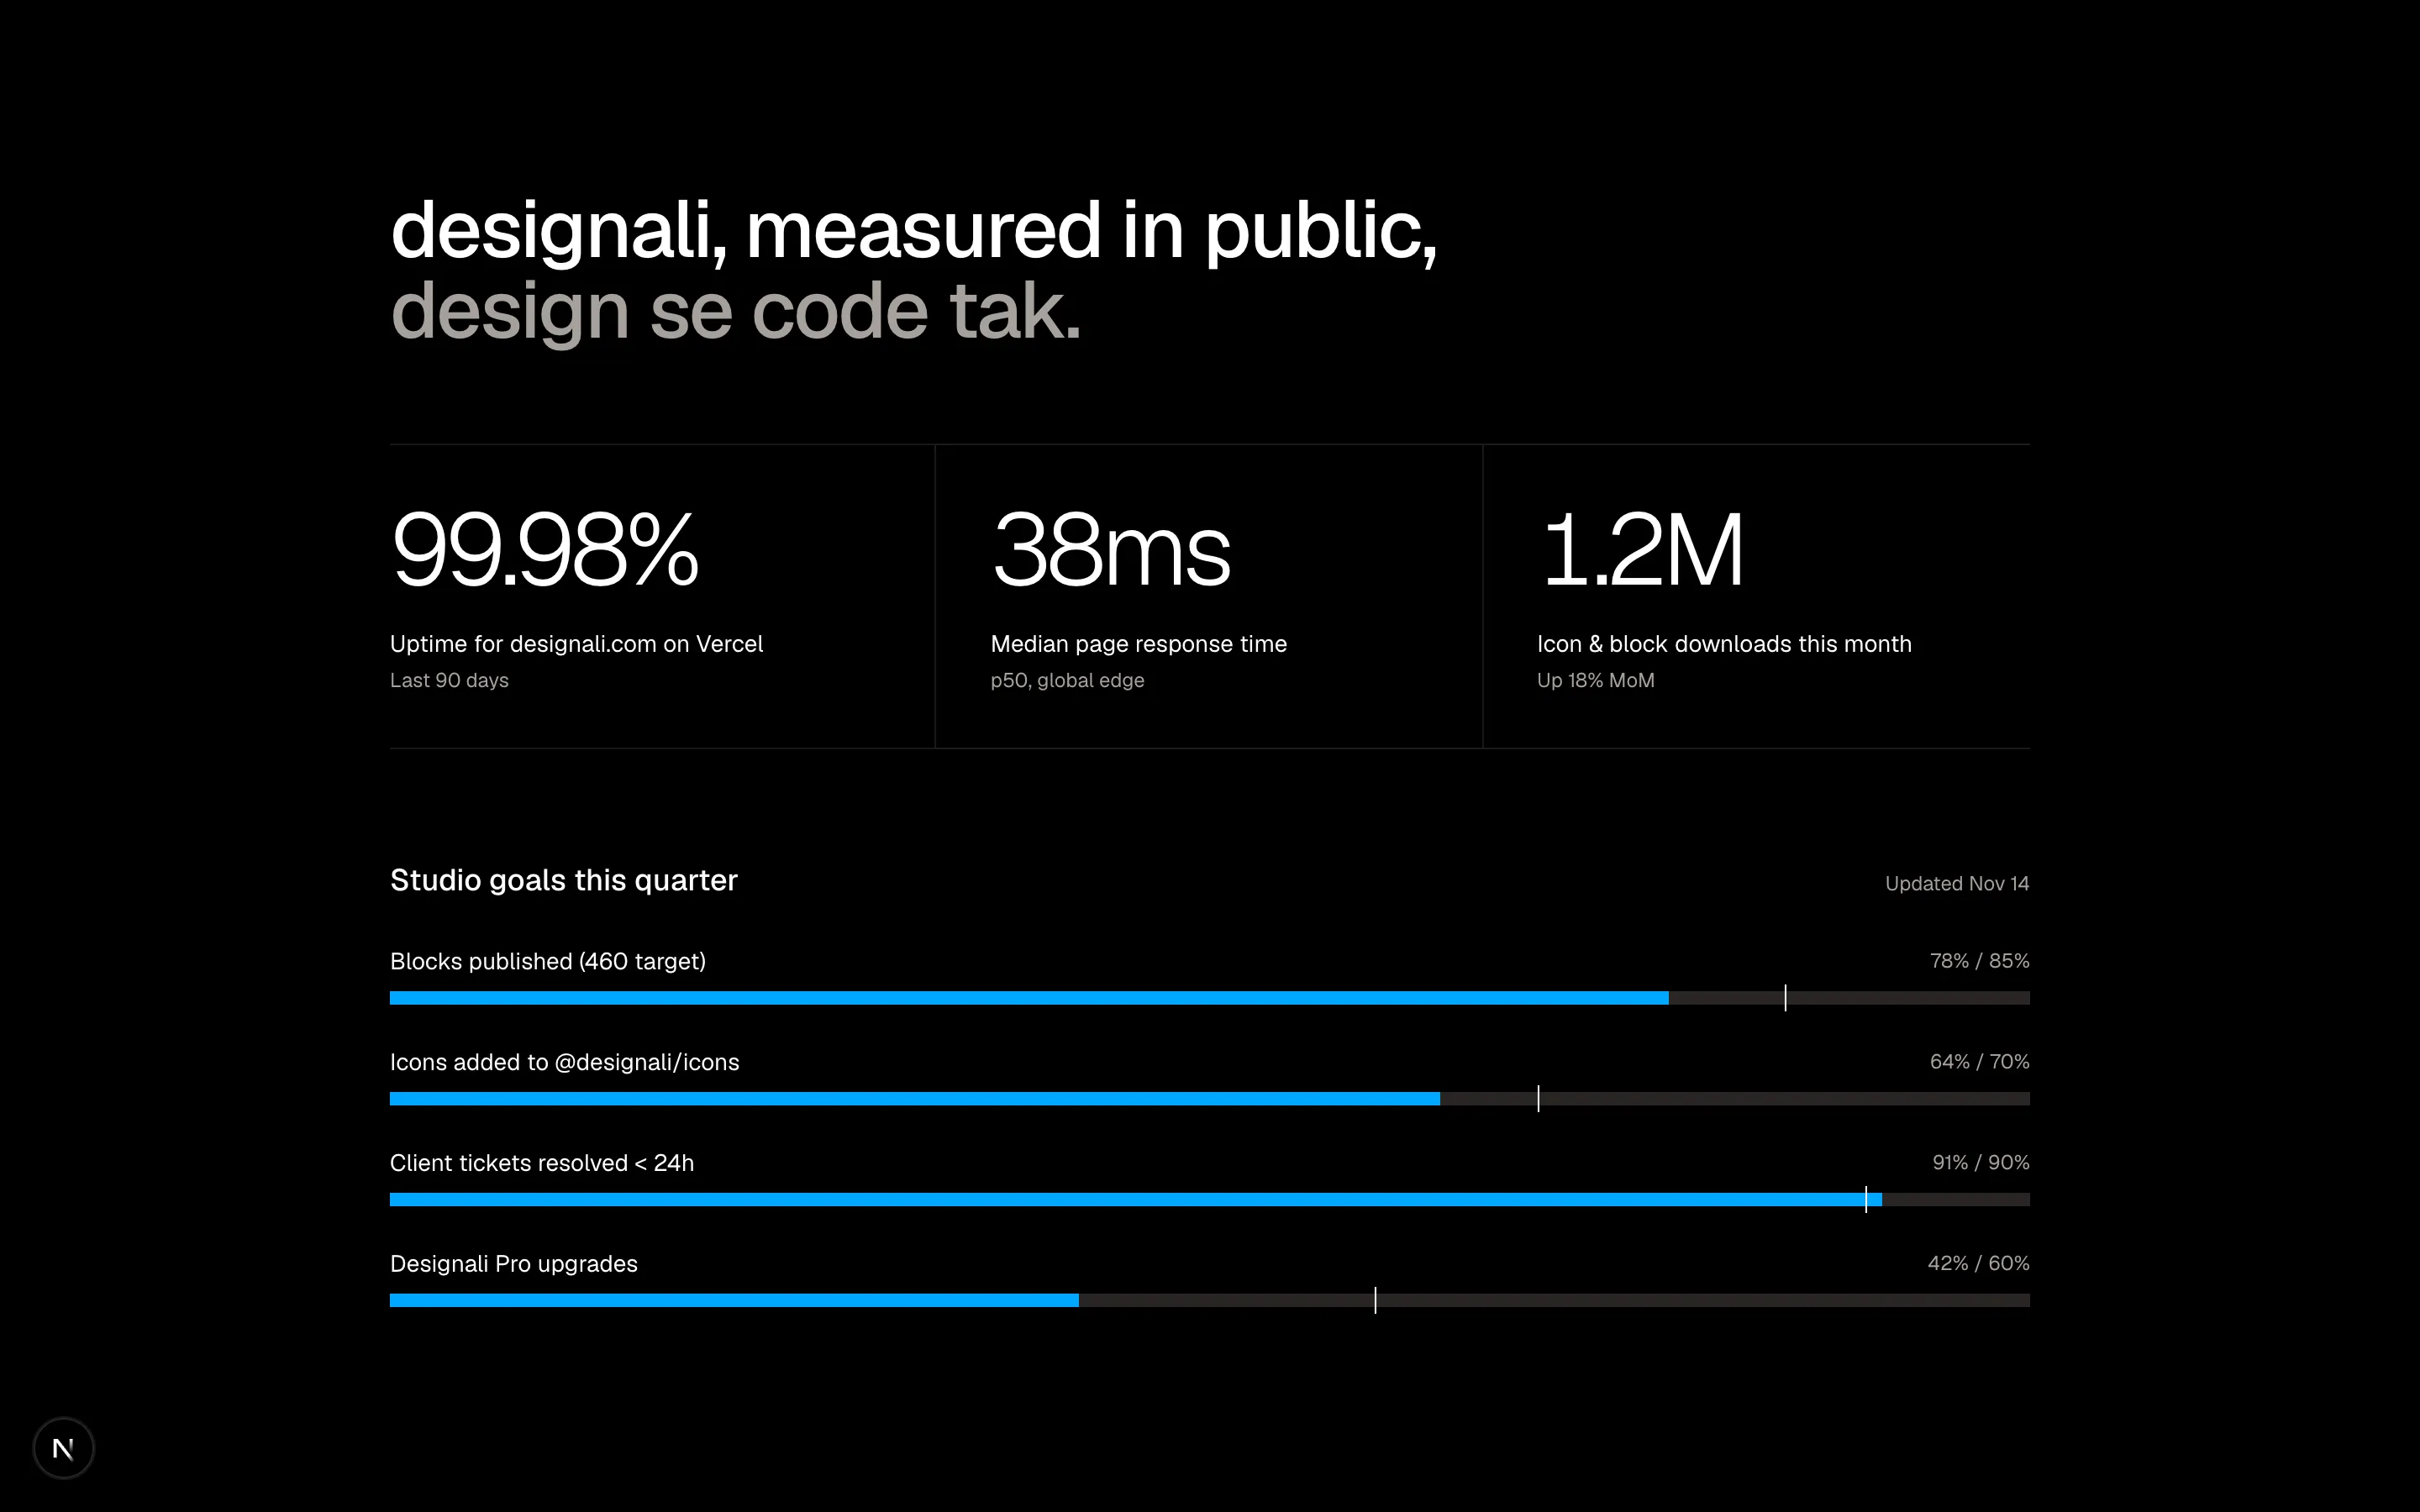
A large-number stats section for infrastructure and growth metrics.
analytics-03
Files
import {
  Download,
} from "@designali/icons"

import { Button } from "@/components/ui/button"

const pages = [
  { path: "/pricing", views: 48210, bounce: 32, time: "2m 41s" },
  { path: "/blogs/design-to-code-with-nextjs", views: 31877, bounce: 41, time: "4m 12s" },
  { path: "/templates", views: 27304, bounce: 28, time: "3m 05s" },
  { path: "/docs", views: 19982, bounce: 22, time: "5m 37s" },
  { path: "/icons", views: 12450, bounce: 47, time: "1m 58s" },
  { path: "/work", views: 8761, bounce: 55, time: "1m 12s" },
]

const days = ["Mon", "Tue", "Wed", "Thu", "Fri", "Sat", "Sun"]
const heat = [
  [2, 3, 5, 7, 6, 4],
  [3, 4, 6, 8, 7, 5],
  [3, 5, 7, 9, 8, 5],
  [2, 4, 6, 8, 9, 6],
  [2, 3, 5, 6, 5, 3],
  [1, 2, 2, 3, 3, 2],
  [1, 1, 2, 3, 2, 2],
]
const slots = ["00", "04", "08", "12", "16", "20"]

export function Analytics04() {
  const maxViews = pages[0]?.views ?? 1

  return (
    <section className="w-full bg-background py-16 text-foreground md:py-24">
      <div className="mx-auto max-w-6xl px-6">
        <div className="mb-8 flex flex-col justify-between gap-4 border-b border-border pb-6 sm:flex-row sm:items-center">
          <div>
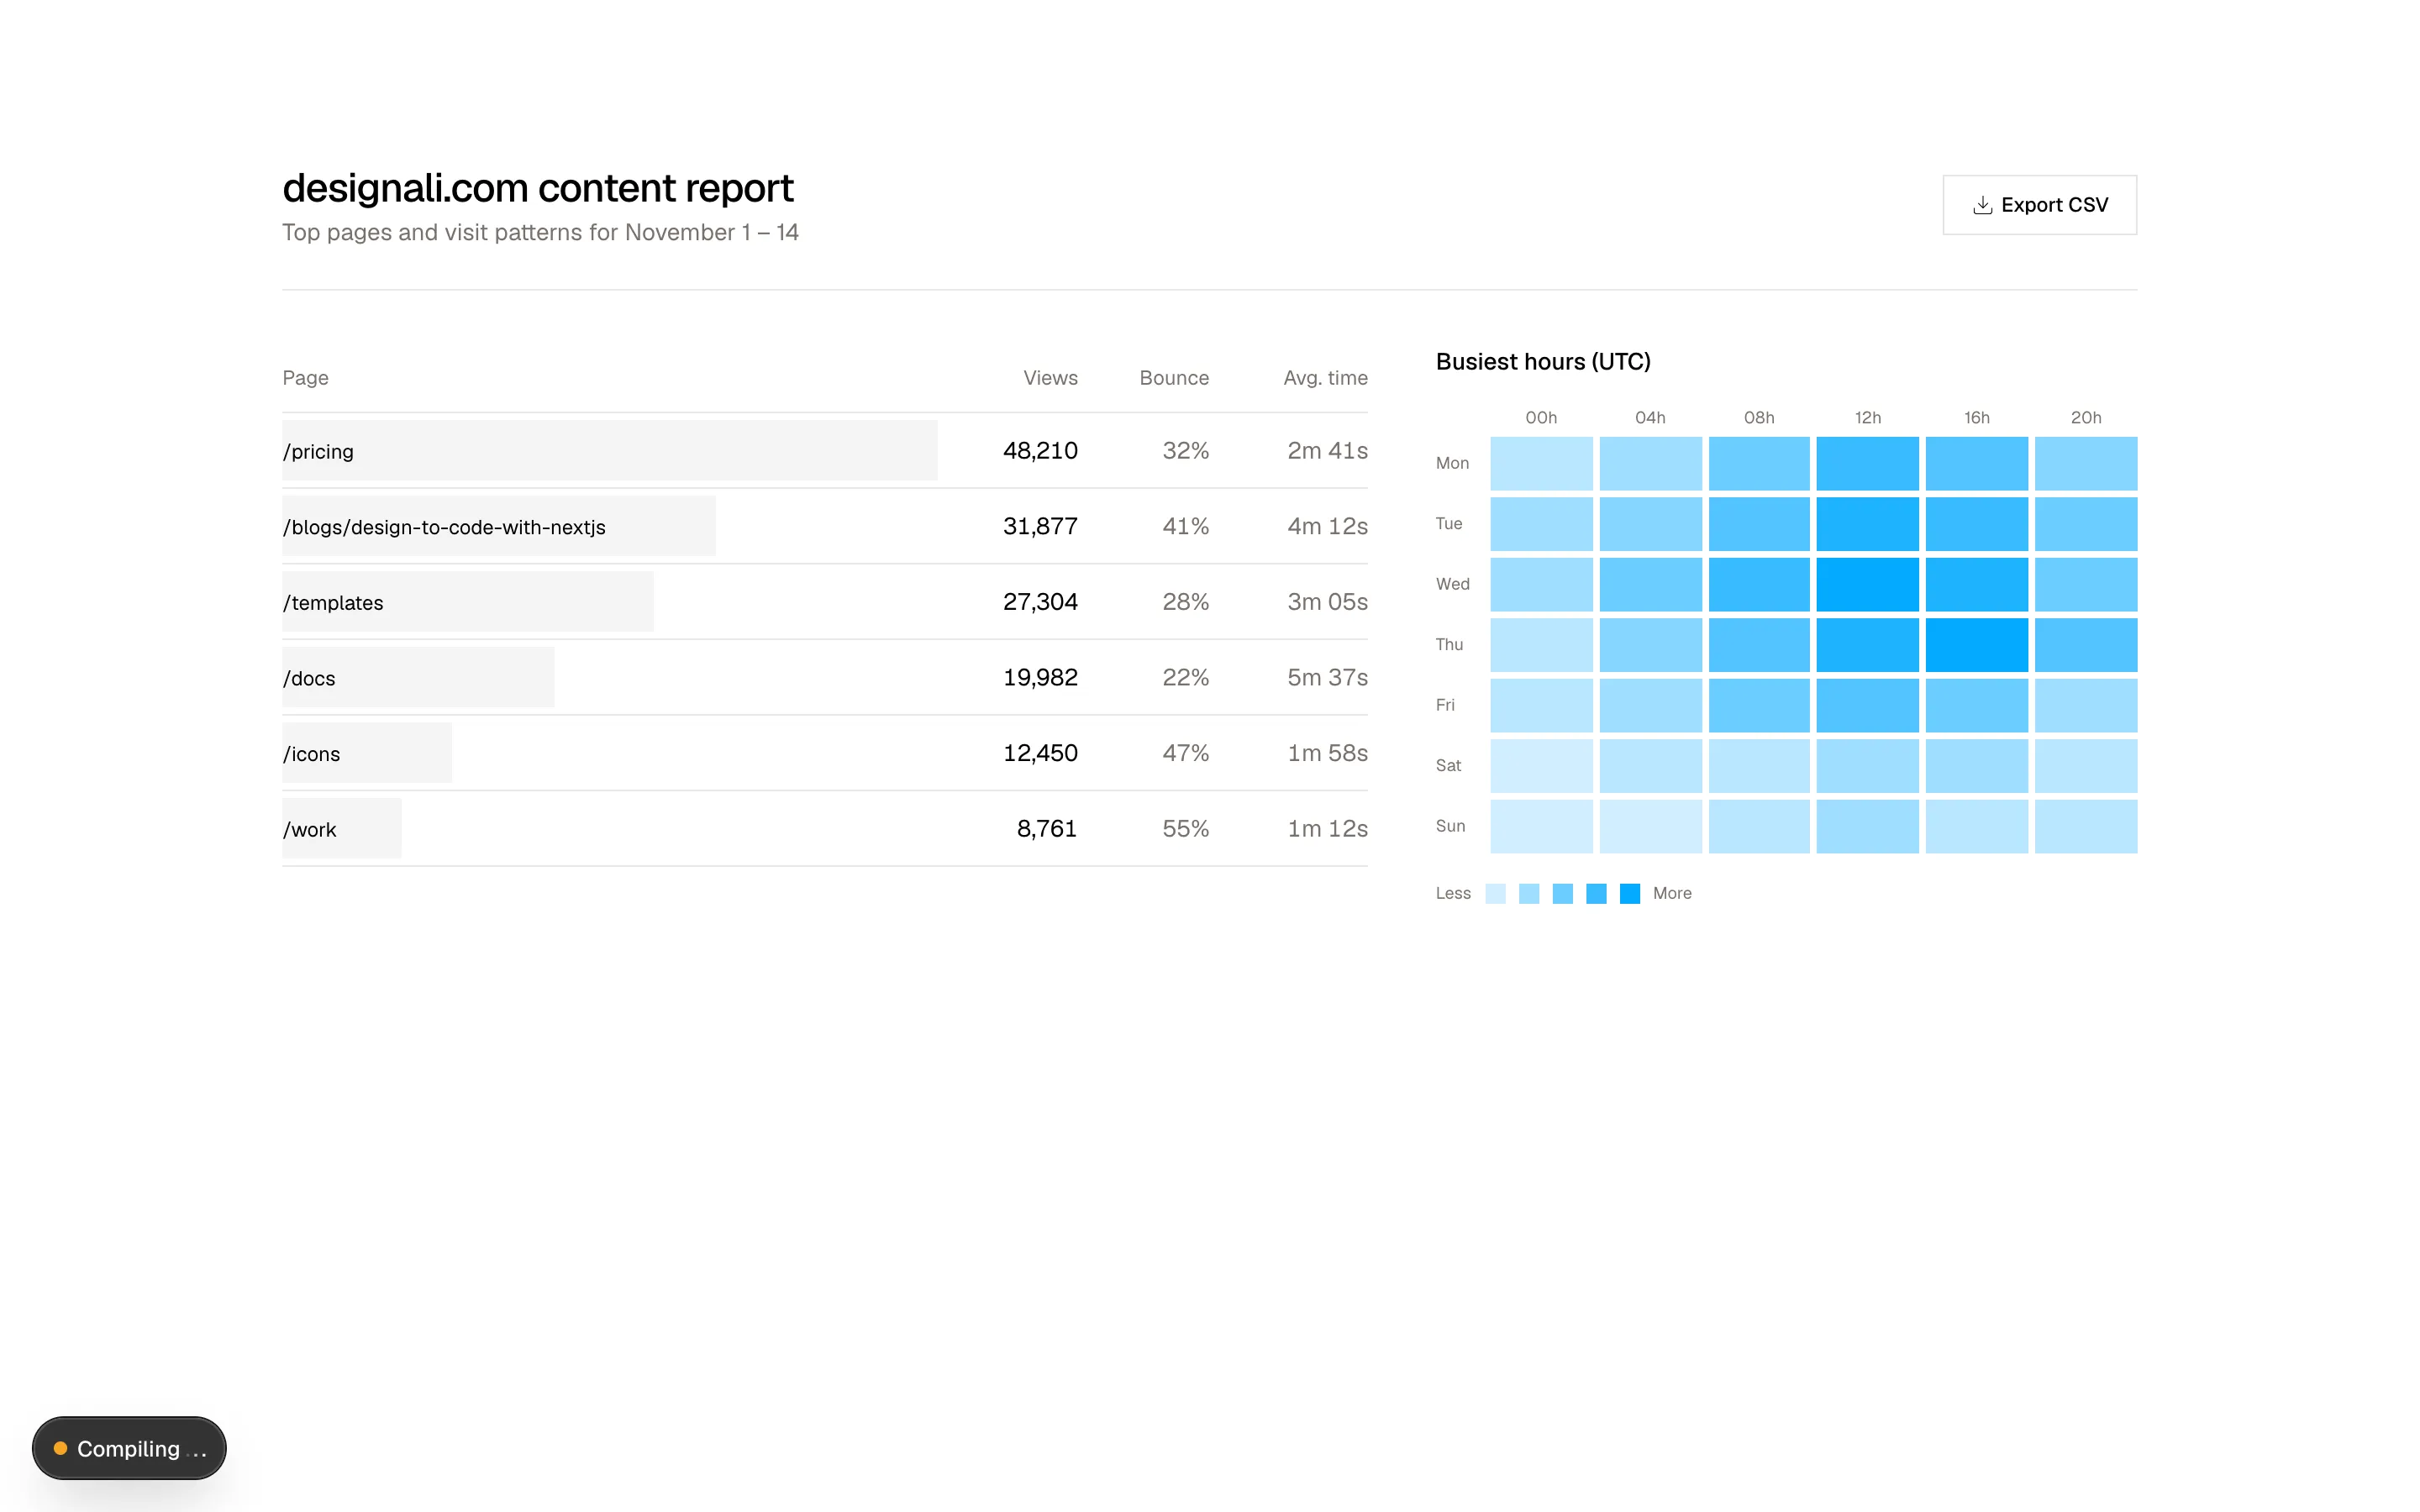
            <h2 className="text-2xl font-medium tracking-tight">designali.com content report</h2>
            <p className="text-sm text-muted-foreground">
              Top pages and visit patterns for November 1 – 14
            </p>
          </div>
          <Button variant="outline" size="md">
            <Download />
            Export CSV
          </Button>
        </div>

        <div className="grid gap-10 lg:grid-cols-5">
          <div className="overflow-x-auto lg:col-span-3">
            <table className="w-full min-w-[480px] text-sm">
              <thead>
                <tr className="border-b border-border text-left text-xs text-muted-foreground">
                  <th className="py-3 font-normal">Page</th>
                  <th className="py-3 text-right font-normal">Views</th>
                  <th className="py-3 text-right font-normal">Bounce</th>
                  <th className="py-3 text-right font-normal">Avg. time</th>
                </tr>
              </thead>
              <tbody>
                {pages.map((page) => (
                  <tr key={page.path} className="border-b border-border">
                    <td className="relative py-3 pr-4">
                      <div
                        className="absolute inset-y-1 left-0 bg-muted"
                        style={{ width: `${(page.views / maxViews) * 100}%` }}
                      />
                      <span className="relative font-sans text-xs">{page.path}</span>
                    </td>
                    <td className="py-3 text-right tabular-nums">
                      {page.views.toLocaleString()}
                    </td>
                    <td className="py-3 text-right tabular-nums text-muted-foreground">
                      {page.bounce}%
                    </td>
                    <td className="py-3 text-right tabular-nums text-muted-foreground">
                      {page.time}
                    </td>
                  </tr>
                ))}
              </tbody>
            </table>
          </div>

          <div className="lg:col-span-2">
            <p className="mb-4 text-sm font-medium">Busiest hours (UTC)</p>
            <div className="grid grid-cols-[auto_repeat(6,1fr)] gap-1 text-[10px] text-muted-foreground">
              <span />
              {slots.map((slot) => (
                <span key={slot} className="text-center">
                  {slot}h
                </span>
              ))}
              {days.map((day, row) => (
                <div key={day} className="contents">
                  <span className="pr-2 leading-8">{day}</span>
                  {heat[row]?.map((level, col) => (
                    <div
                      key={col}
                      className="h-8 bg-primary"
                      style={{ opacity: 0.08 + level * 0.1 }}
                      title={`${day} ${slots[col]}:00 – intensity ${level}`}
                    />
                  ))}
                </div>
              ))}
            </div>
            <div className="mt-4 flex items-center gap-2 text-[10px] text-muted-foreground">
              Less
              {[1, 3, 5, 7, 9].map((level) => (
                <span
                  key={level}
                  className="size-3 bg-primary"
                  style={{ opacity: 0.08 + level * 0.1 }}
                />
              ))}
              More
            </div>
          </div>
        </div>
      </div>
    </section>
  )
}
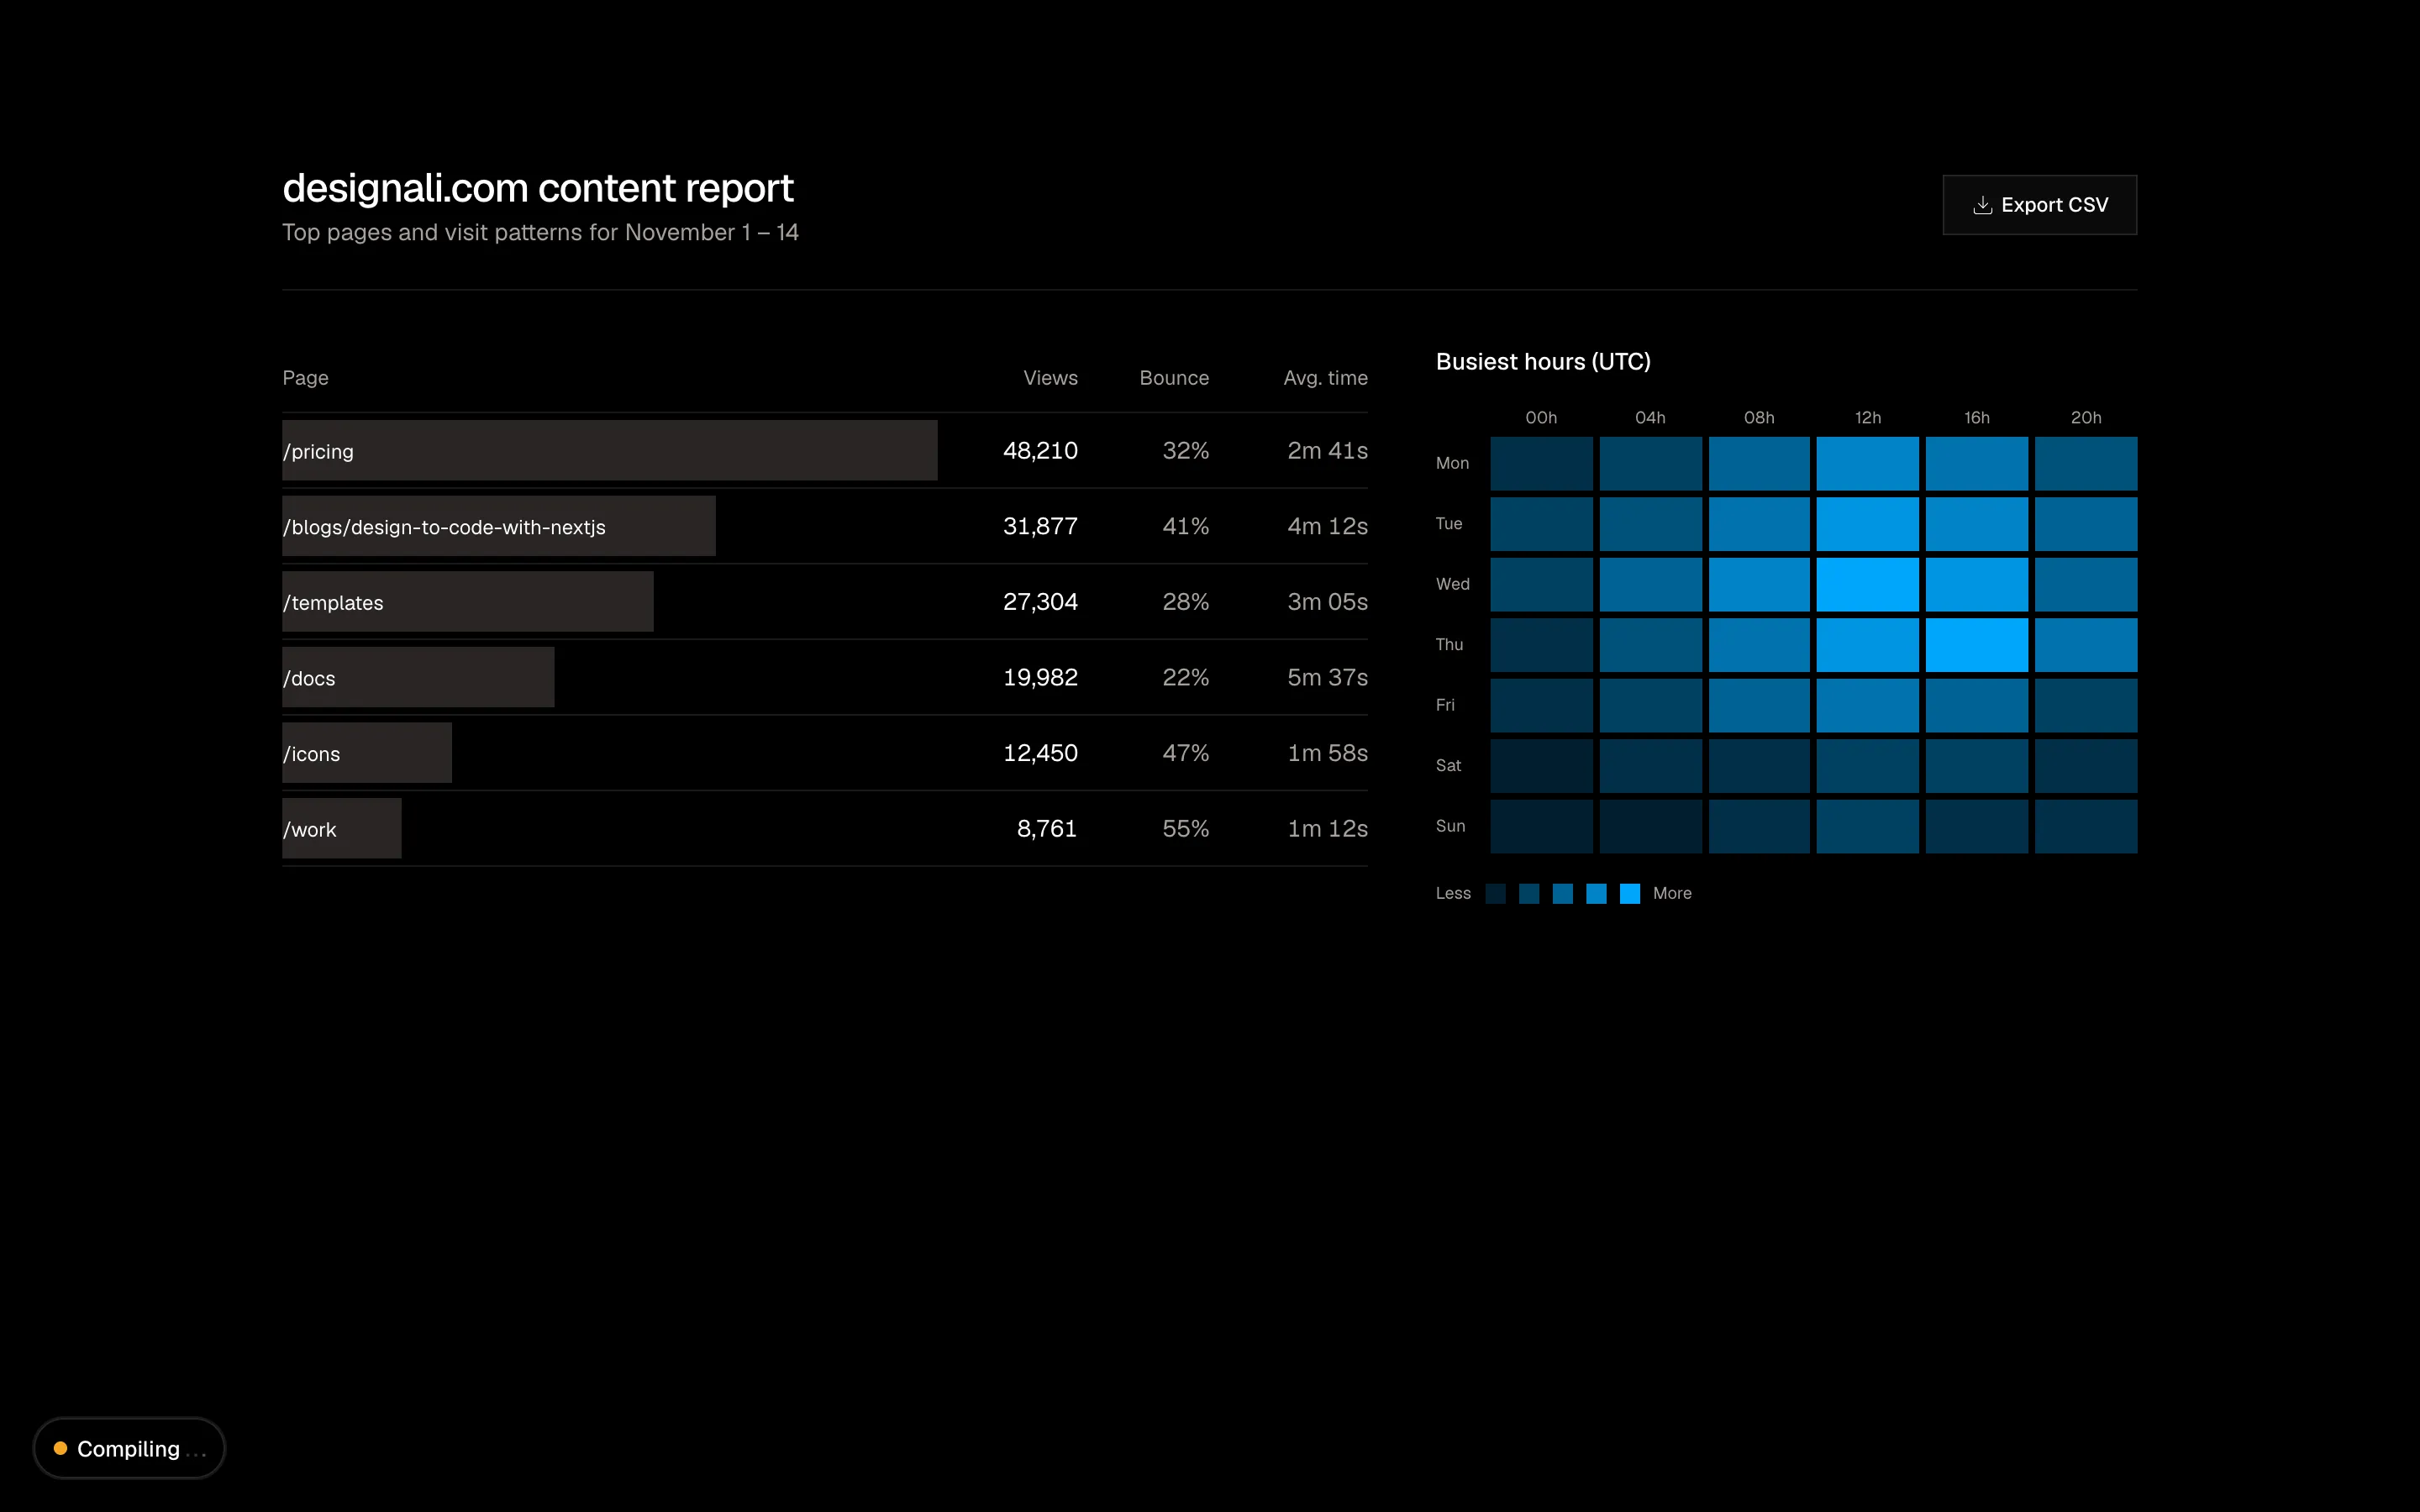
A content report with top pages table and visit patterns.
analytics-04
Files
import { CounterNumber } from "@/components/ui/counter-number"

const funnel = [
  { step: "Visited designali.com", users: 24800 },
  { step: "Browsed /blocks", users: 6120 },
  { step: "Copied a free block", users: 3940 },
  { step: "Downloaded @designali/icons", users: 1870 },
  { step: "Bought Designali Pro", users: 742 },
]

const segments = [
  { label: "Design engineers", value: 46, color: "var(--chart-1)" },
  { label: "Agencies", value: 28, color: "var(--chart-2)" },
  { label: "Freelancers", value: 17, color: "var(--chart-3)" },
  { label: "Startups", value: 9, color: "var(--chart-4)" },
]

export function Analytics05() {
  const top = funnel[0]?.users ?? 1
  const radius = 40
  const circumference = 2 * Math.PI * radius
  let offset = 0

  return (
    <section className="w-full bg-background py-16 text-foreground md:py-24">
      <div className="mx-auto grid max-w-6xl gap-12 px-6 lg:grid-cols-[1.4fr_1fr]">
        <div>
          <p className="text-xs tracking-widest text-muted-foreground uppercase">
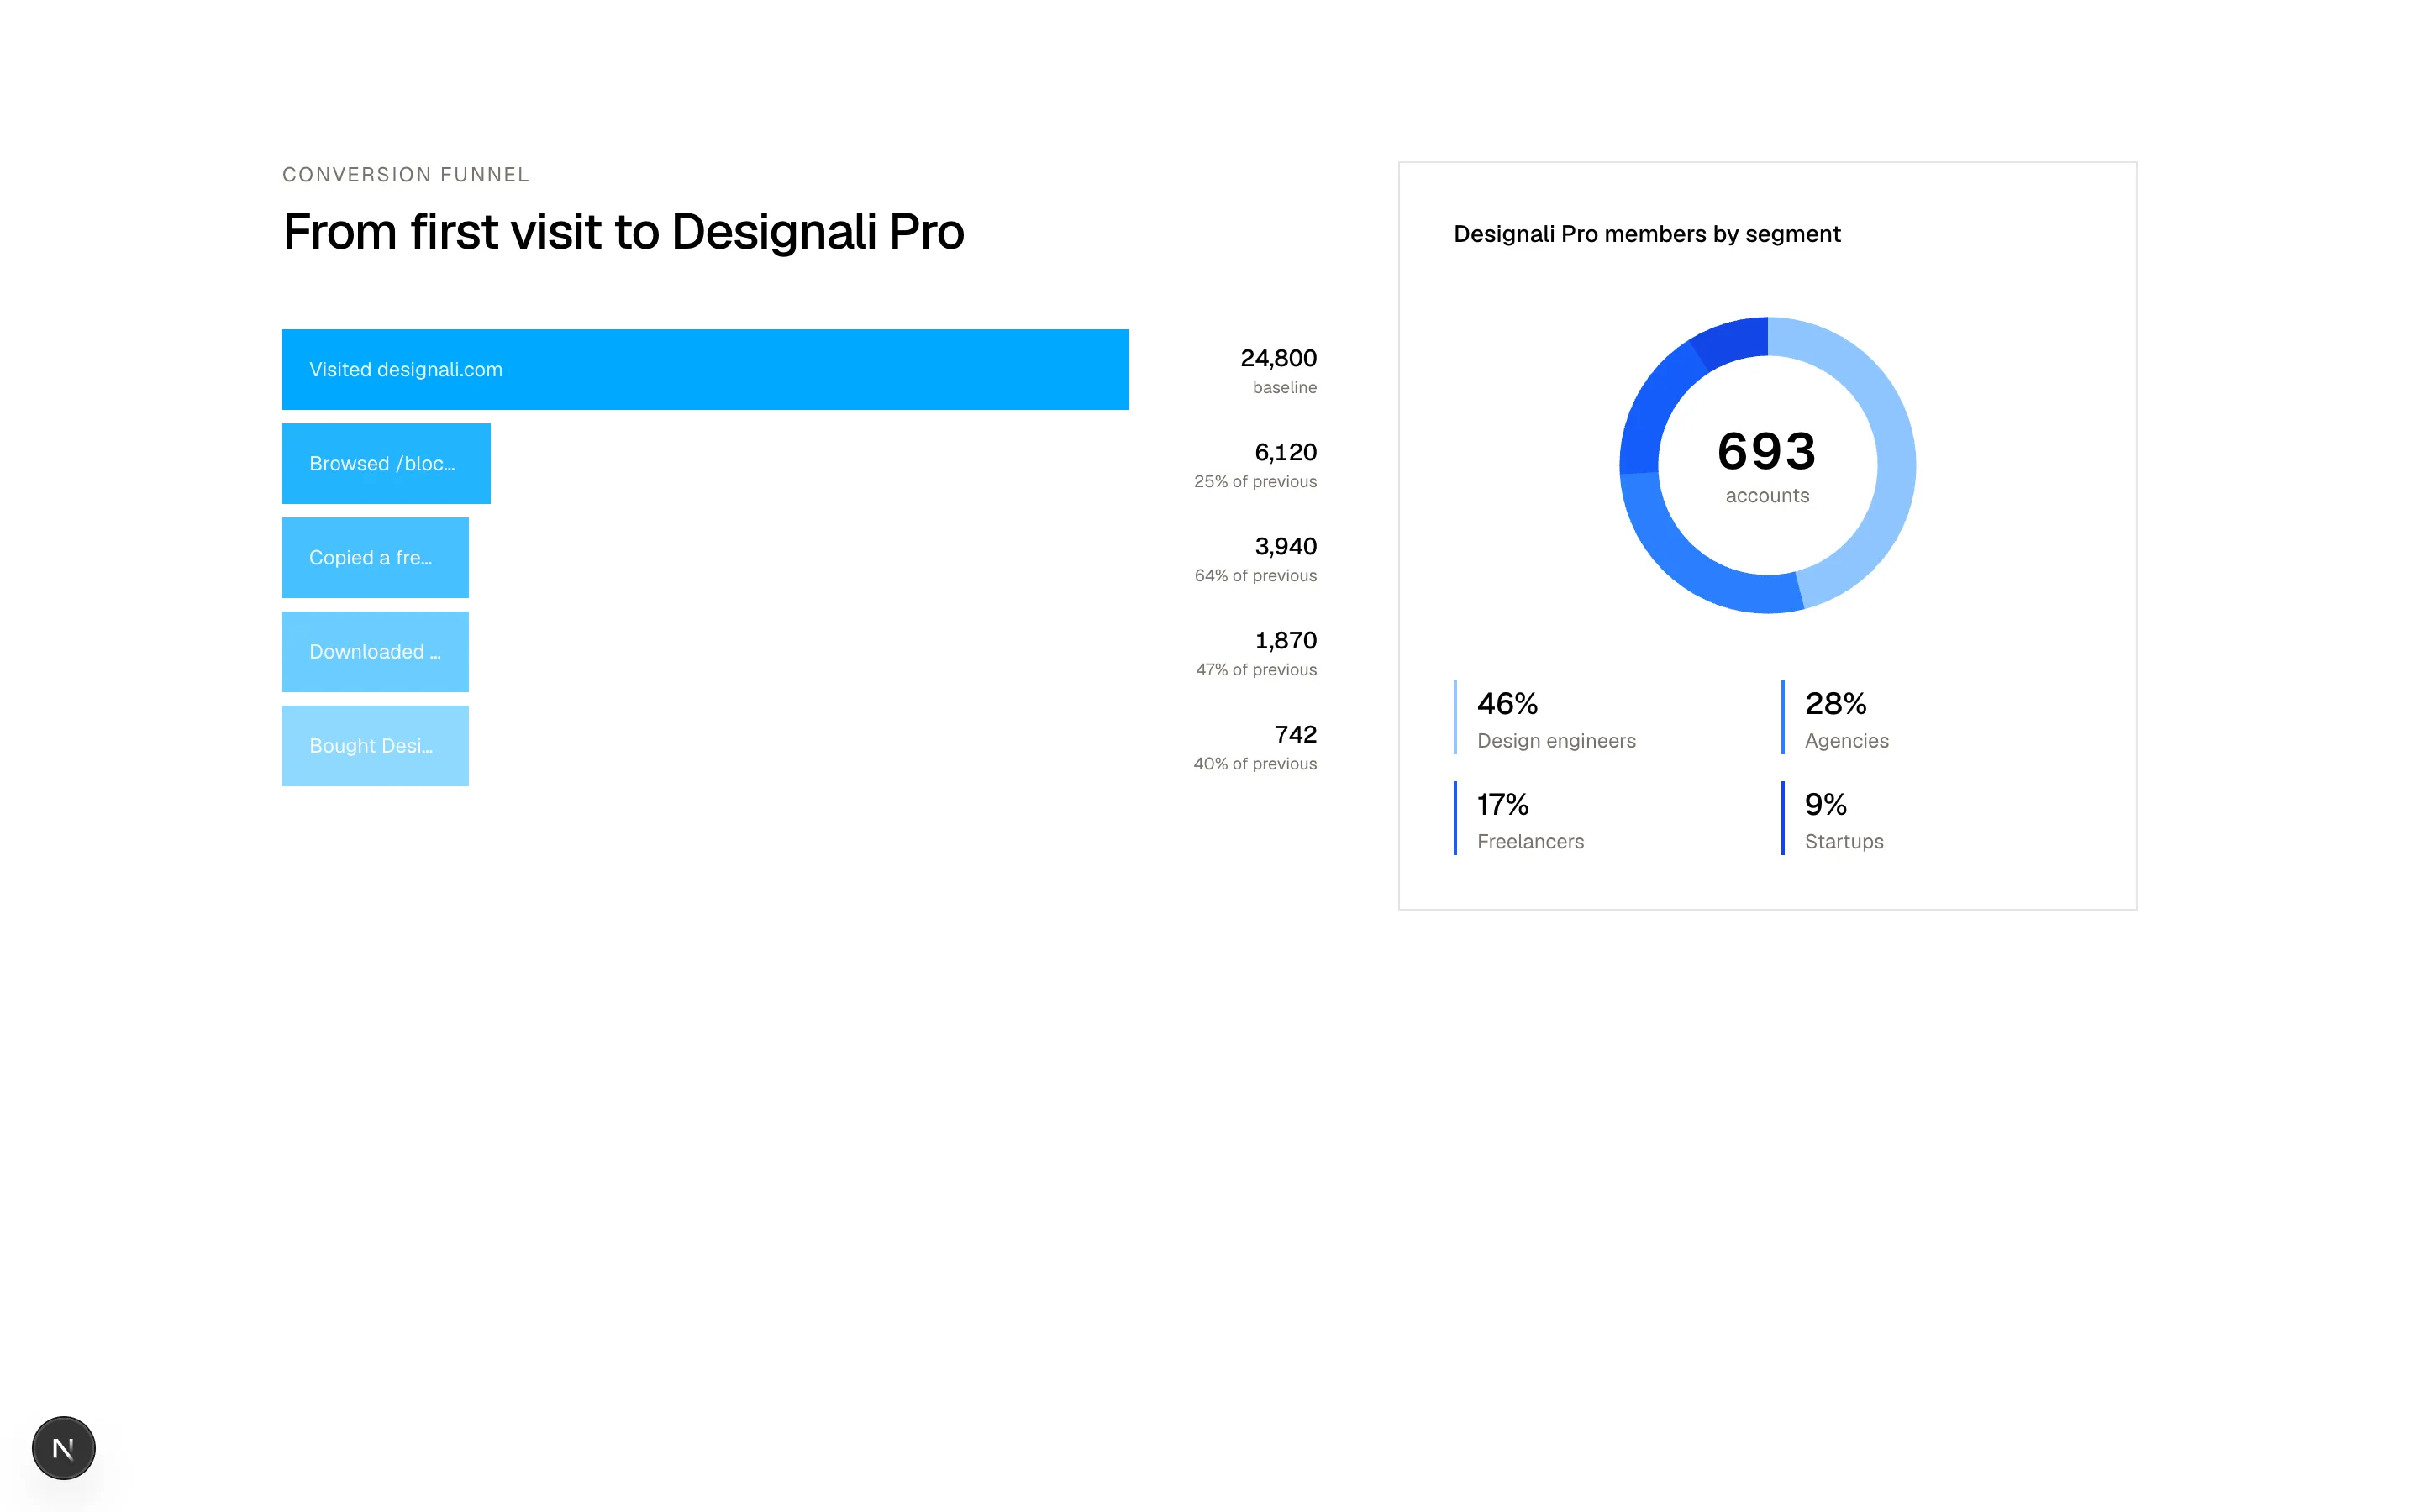
            Conversion funnel
          </p>
          <h2 className="mt-2 text-3xl font-medium tracking-tight">
            From first visit to Designali Pro
          </h2>
          <div className="mt-10 space-y-2">
            {funnel.map((item, i) => {
              const prev = funnel[i - 1]
              const rate = prev ? Math.round((item.users / prev.users) * 100) : 100
              return (
                <div key={item.step} className="flex items-center gap-4">
                  <div className="flex-1">
                    <div
                      className="flex h-12 items-center justify-between bg-primary px-4 text-primary-foreground"
                      style={{
                        width: `${Math.max((item.users / top) * 100, 22)}%`,
                        opacity: 1 - i * 0.14,
                      }}
                    >
                      <span className="truncate text-xs">{item.step}</span>
                    </div>
                  </div>
                  <div className="w-24 shrink-0 text-right">
                    <p className="text-sm font-medium tabular-nums">
                      {item.users.toLocaleString()}
                    </p>
                    <p className="text-[10px] text-muted-foreground">
                      {i === 0 ? "baseline" : `${rate}% of previous`}
                    </p>
                  </div>
                </div>
              )
            })}
          </div>
        </div>

        <div className="border border-border p-6 md:p-8">
          <p className="text-sm font-medium">Designali Pro members by segment</p>
          <div className="relative mx-auto mt-8 size-48">
            <svg viewBox="0 0 100 100" className="size-full -rotate-90">
              {segments.map((segment) => {
                const length = (segment.value / 100) * circumference
                const circle = (
                  <circle
                    key={segment.label}
                    cx="50"
                    cy="50"
                    r={radius}
                    fill="none"
                    stroke={segment.color}
                    strokeWidth="12"
                    strokeDasharray={`${length} ${circumference - length}`}
                    strokeDashoffset={-offset}
                  />
                )
                offset += length
                return circle
              })}
            </svg>
            <div className="absolute inset-0 flex flex-col items-center justify-center">
              <CounterNumber value={742} className="text-3xl font-semibold" />
              <span className="text-xs text-muted-foreground">accounts</span>
            </div>
          </div>
          <ul className="mt-8 grid grid-cols-2 gap-4">
            {segments.map((segment) => (
              <li key={segment.label} className="border-l-2 pl-3" style={{ borderColor: segment.color }}>
                <p className="text-lg font-medium">{segment.value}%</p>
                <p className="text-xs text-muted-foreground">{segment.label}</p>
              </li>
            ))}
          </ul>
        </div>
      </div>
    </section>
  )
}
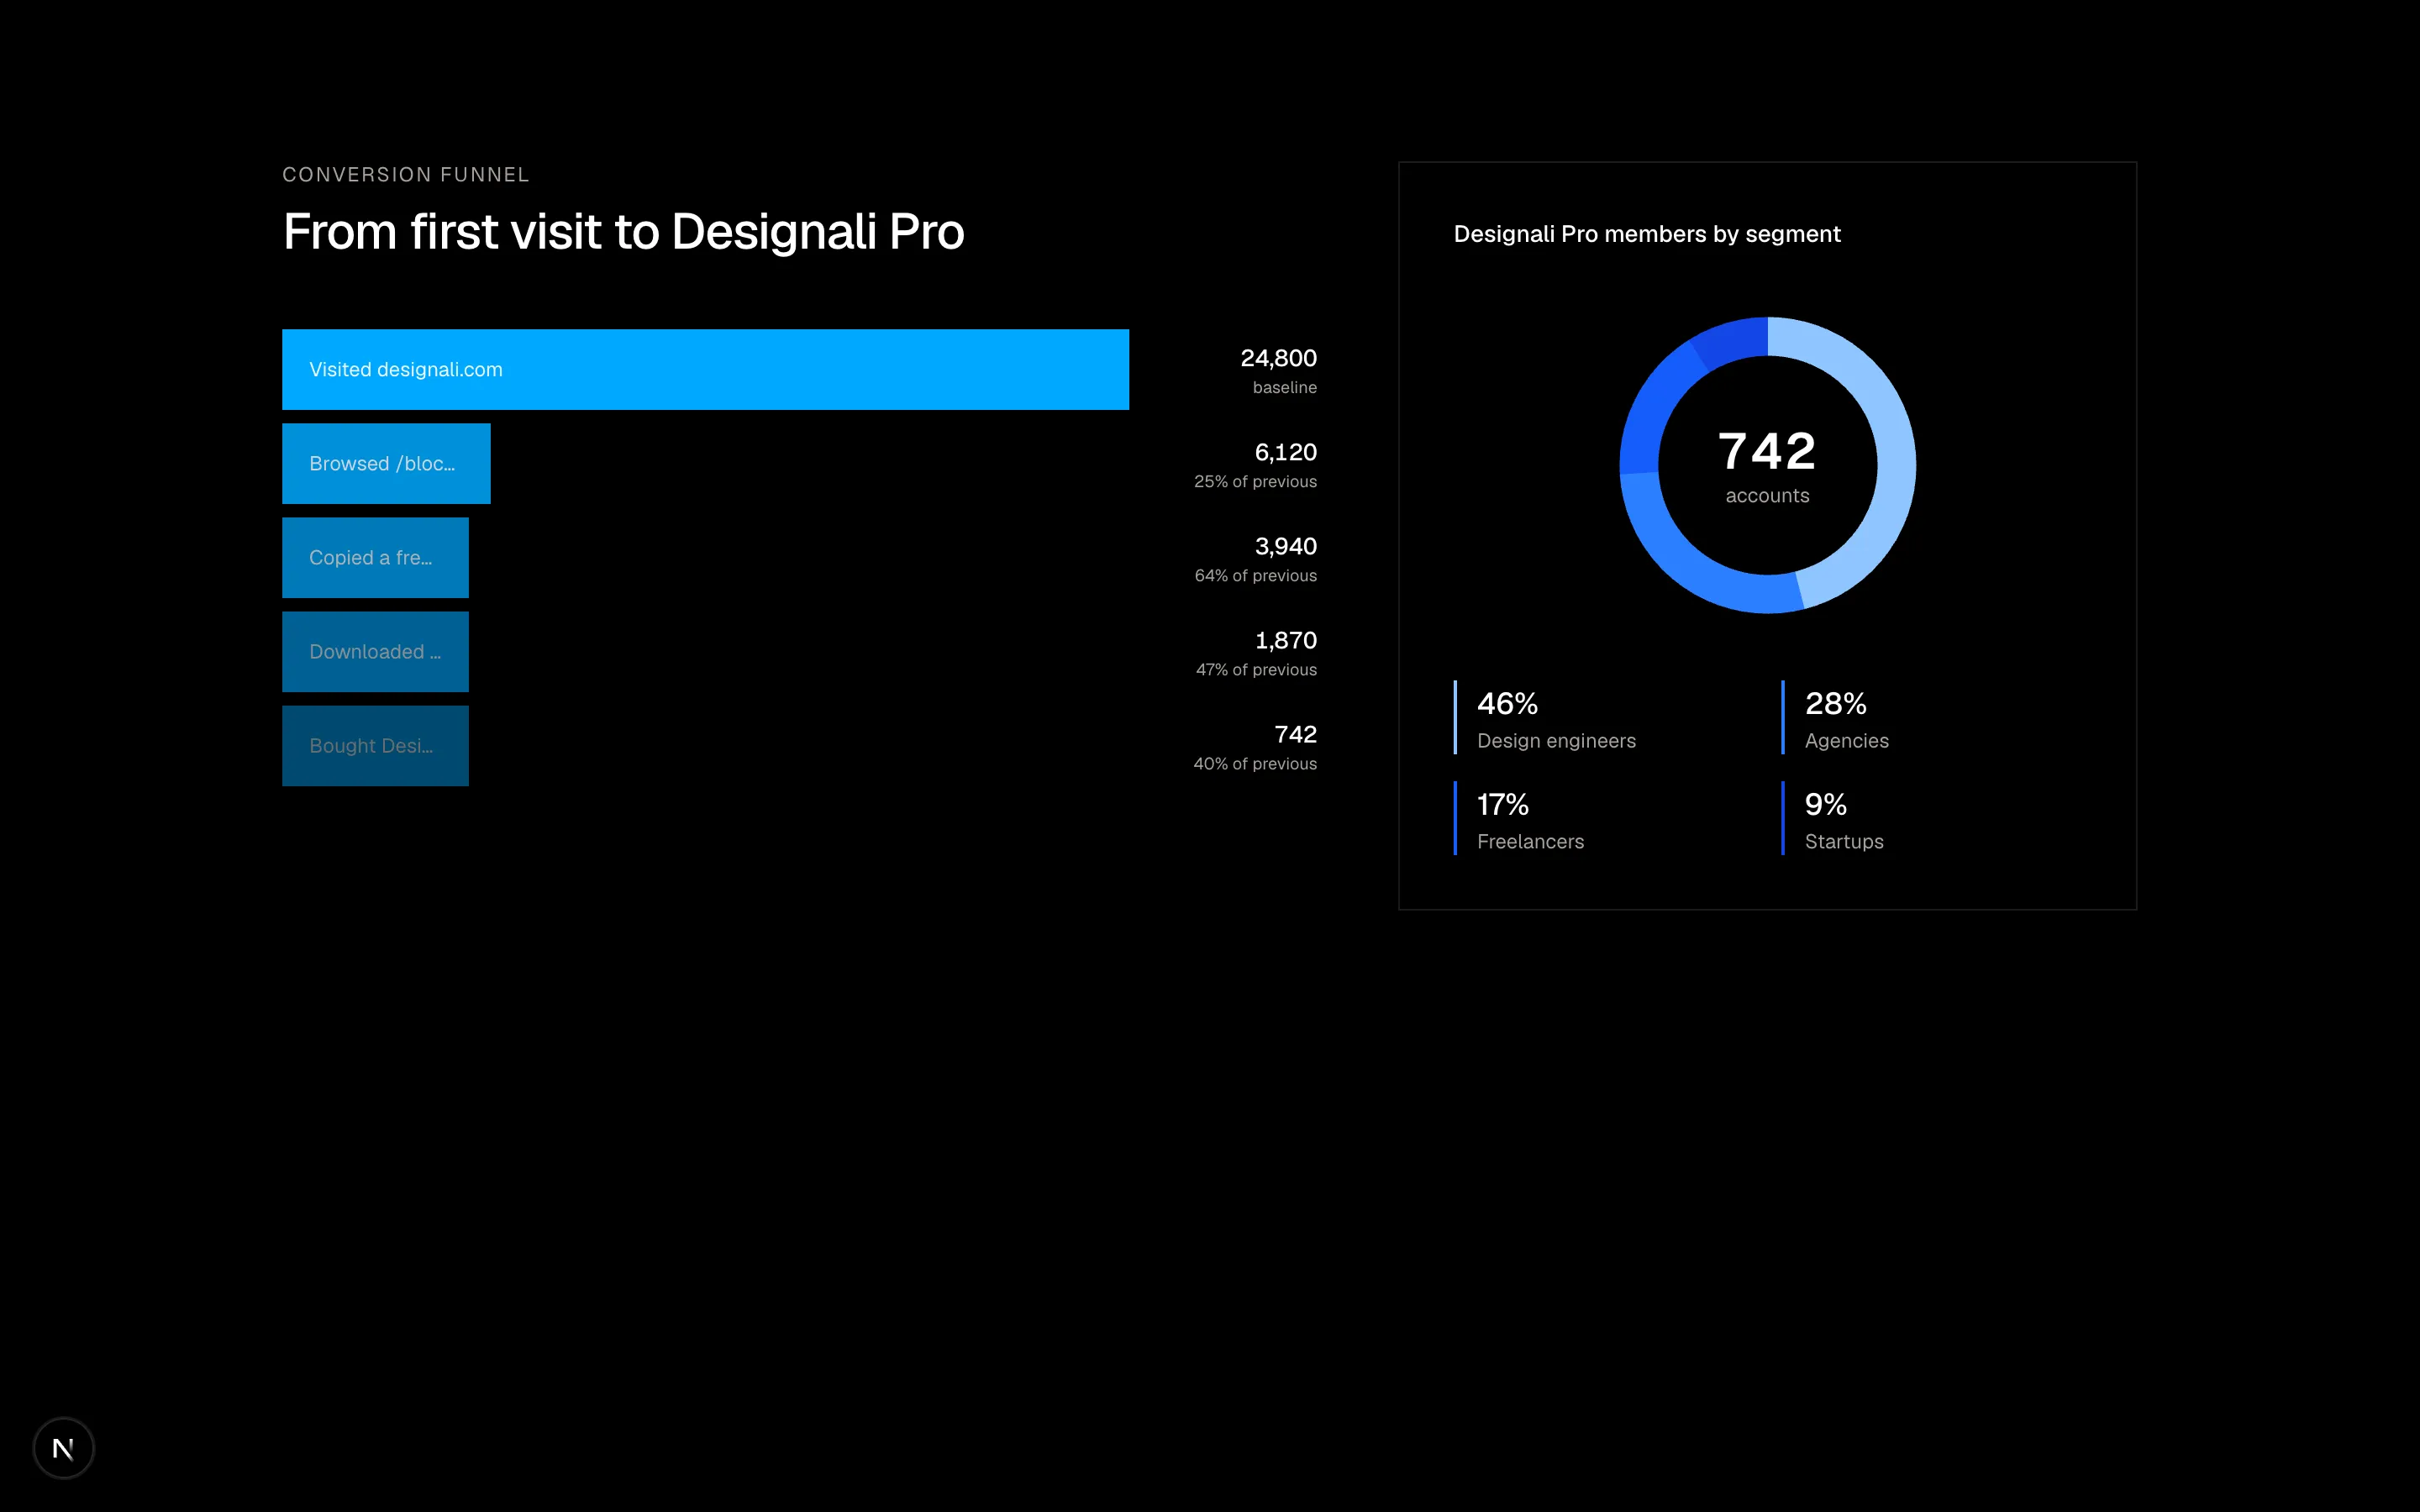
A conversion funnel chart from first visit to paid plan.
analytics-05
Files
import {
  ArrowDownRight,
  ArrowUpRight,
} from "@designali/icons"

import { cn } from "@/lib/utils"

import { CounterNumber } from "@/components/ui/counter-number"

const cards = [
  {
    label: "Template sales",
    value: 1.28,
    prefix: "$",
    suffix: "M",
    decimals: 2,
    change: 14.2,
    data: [12, 14, 13, 17, 16, 19, 22, 21, 24, 26, 25, 29],
  },
  {
    label: "New Designali customers",
    value: 3416,
    prefix: "",
    suffix: "",
    decimals: 0,
    change: 8.7,
    data: [30, 28, 33, 31, 36, 35, 38, 41, 39, 44, 43, 47],
  },
  {
    label: "Refund rate",
    value: 1.9,
    prefix: "",
    suffix: "%",
    decimals: 1,
    change: -0.6,
    data: [28, 26, 27, 24, 25, 22, 21, 22, 19, 18, 18, 16],
  },
  {
    label: "Open support tickets",
    value: 214,
    prefix: "",
    suffix: "",
    decimals: 0,
    change: 11.3,
    data: [14, 15, 13, 16, 18, 17, 21, 20, 23, 22, 25, 27],
    inverse: true,
  },
]

function Sparkline({ data, positive }: { data: number[]; positive: boolean }) {
  const max = Math.max(...data)
  const min = Math.min(...data)
  const points = data
    .map((v, i) => {
      const x = (i / (data.length - 1)) * 100
      const y = 36 - ((v - min) / (max - min || 1)) * 32
      return `${x},${y}`
    })
    .join(" ")
  const tone = positive
    ? "fill-primary stroke-primary"
    : "fill-primary stroke-primary"

  return (
    <svg viewBox="0 0 100 40" preserveAspectRatio="none" className={`h-12 w-full ${tone}`}>
      <polygon points={`0,40 ${points} 100,40`} stroke="none" opacity="0.1" />
      <polyline
        points={points}
        fill="none"
        strokeWidth="1.75"
        vectorEffect="non-scaling-stroke"
        strokeLinejoin="round"
      />
    </svg>
  )
}

export function Analytics06() {
  return (
    <section className="w-full bg-background py-16 text-foreground md:py-24">
      <div className="mx-auto max-w-7xl px-6">
        <div className="mb-8 flex flex-col gap-2 sm:flex-row sm:items-end sm:justify-between">
          <div>
            <h2 className="text-2xl font-medium tracking-tight md:text-3xl">
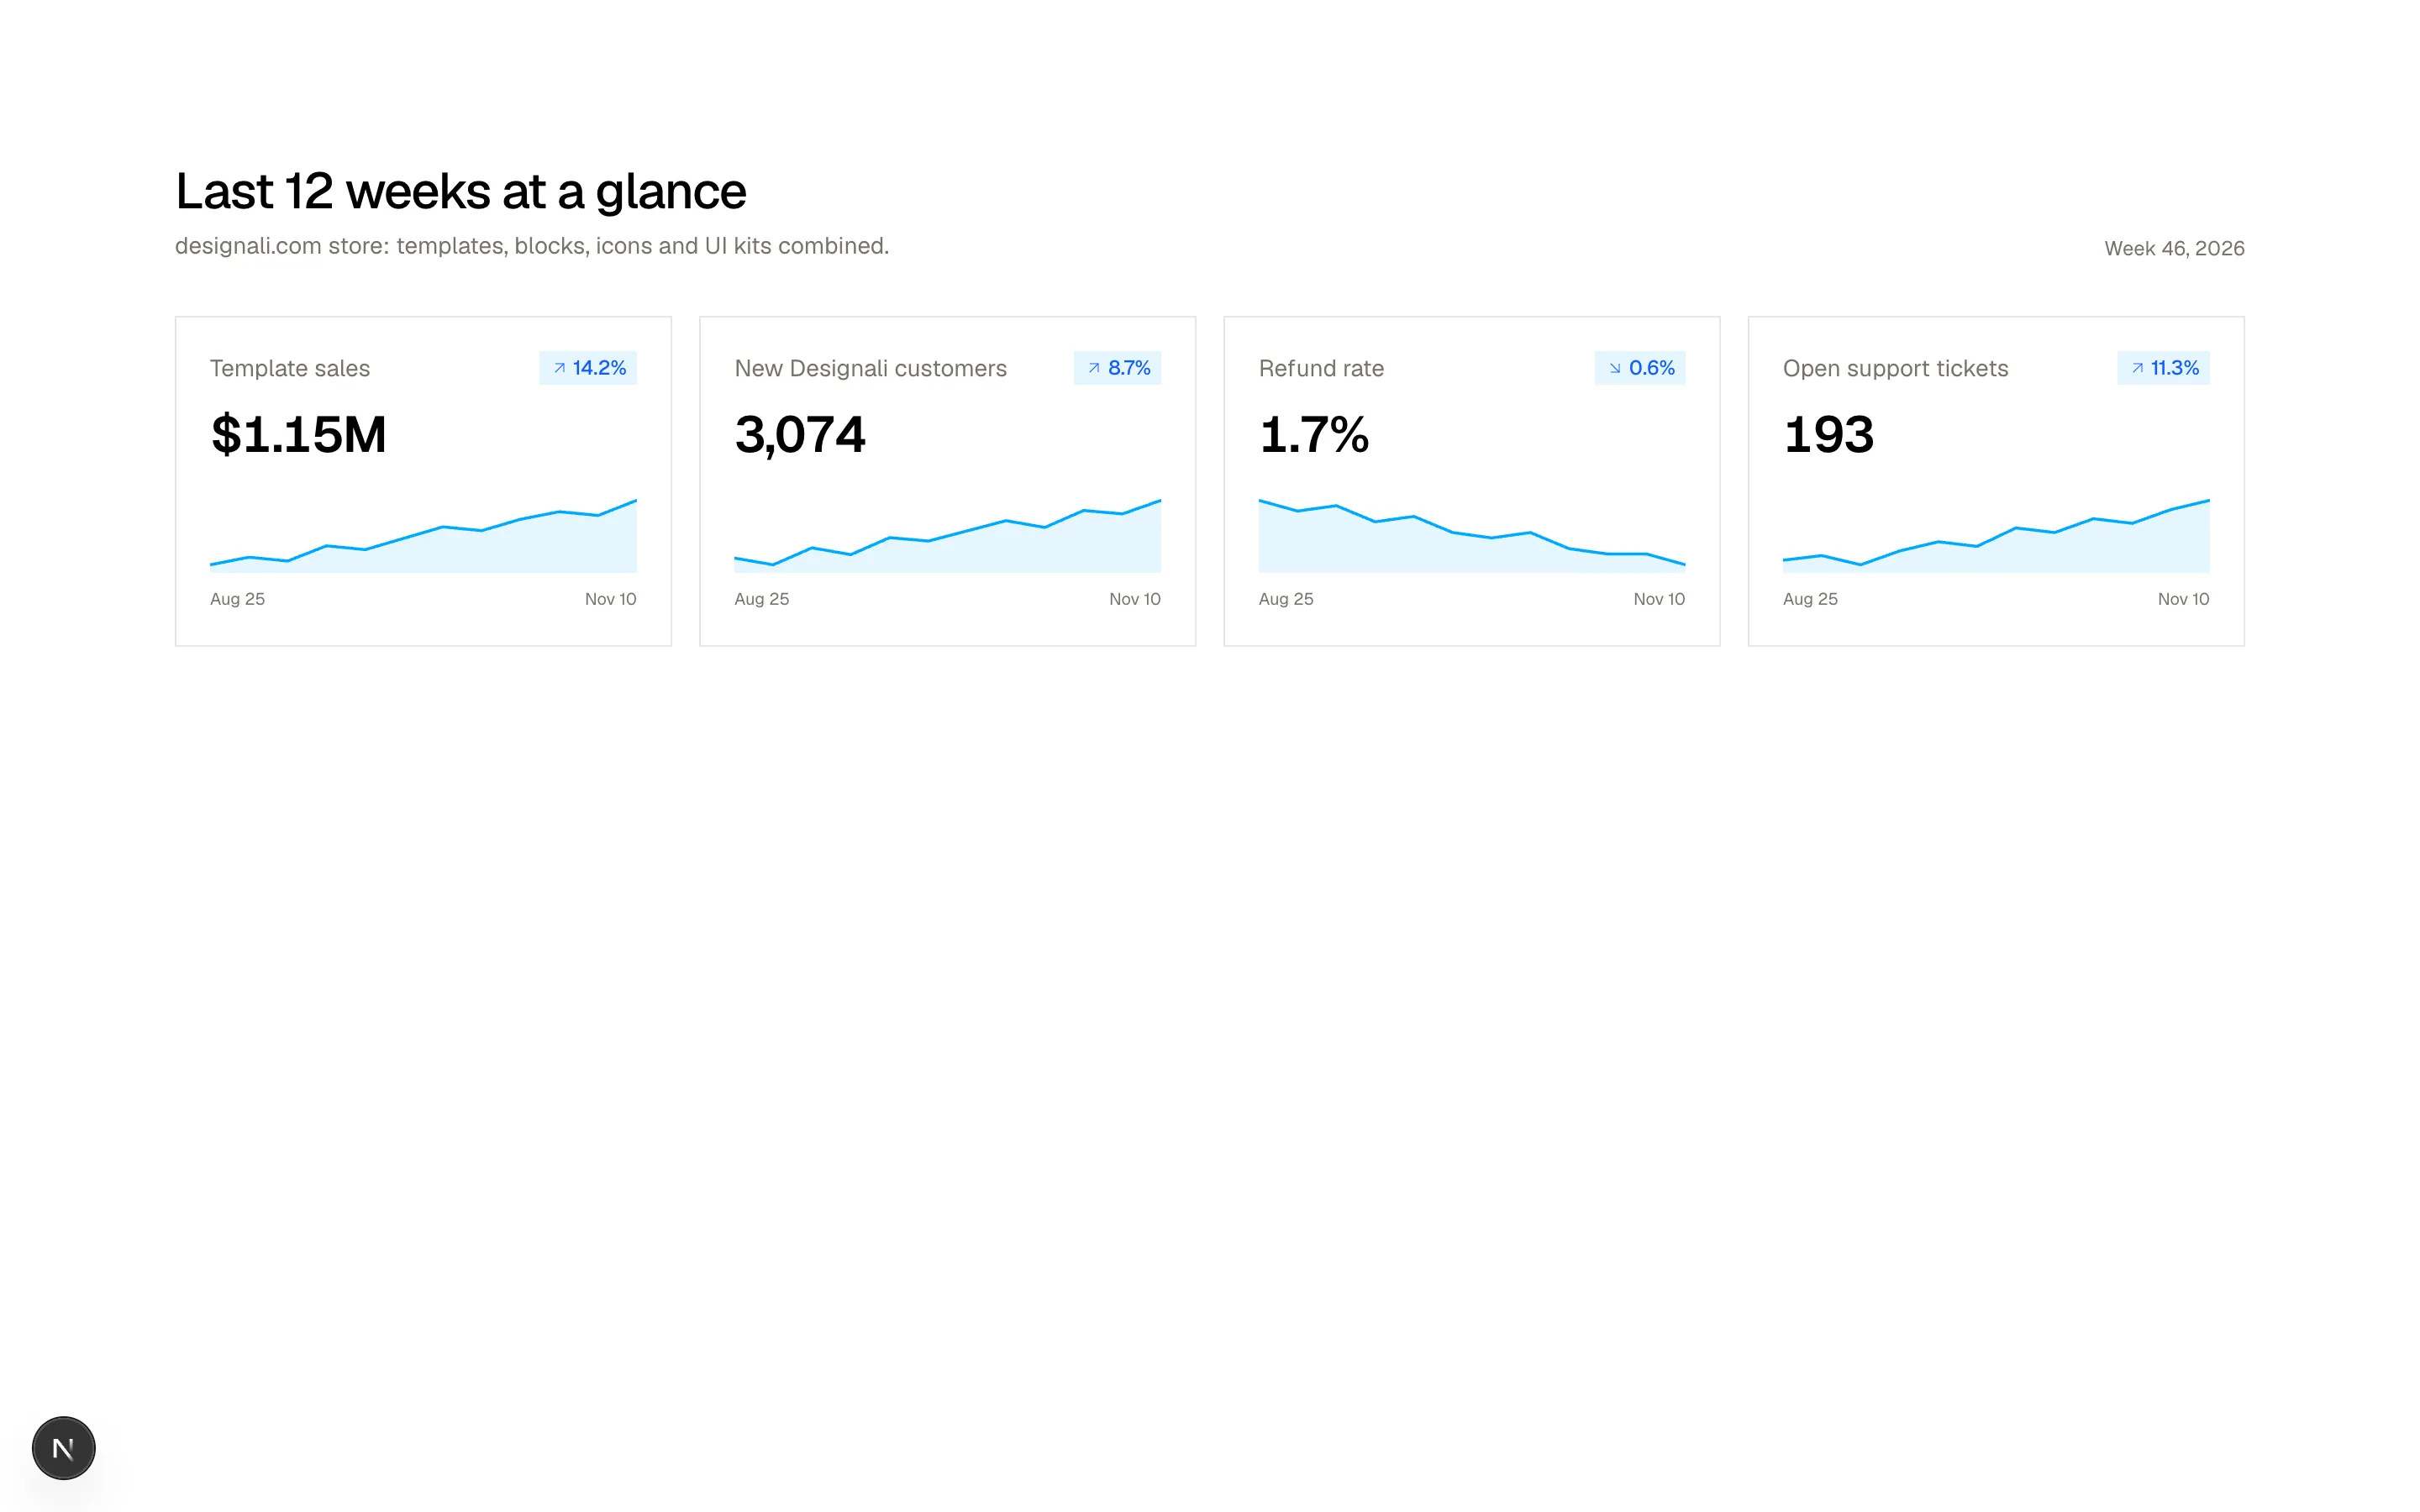
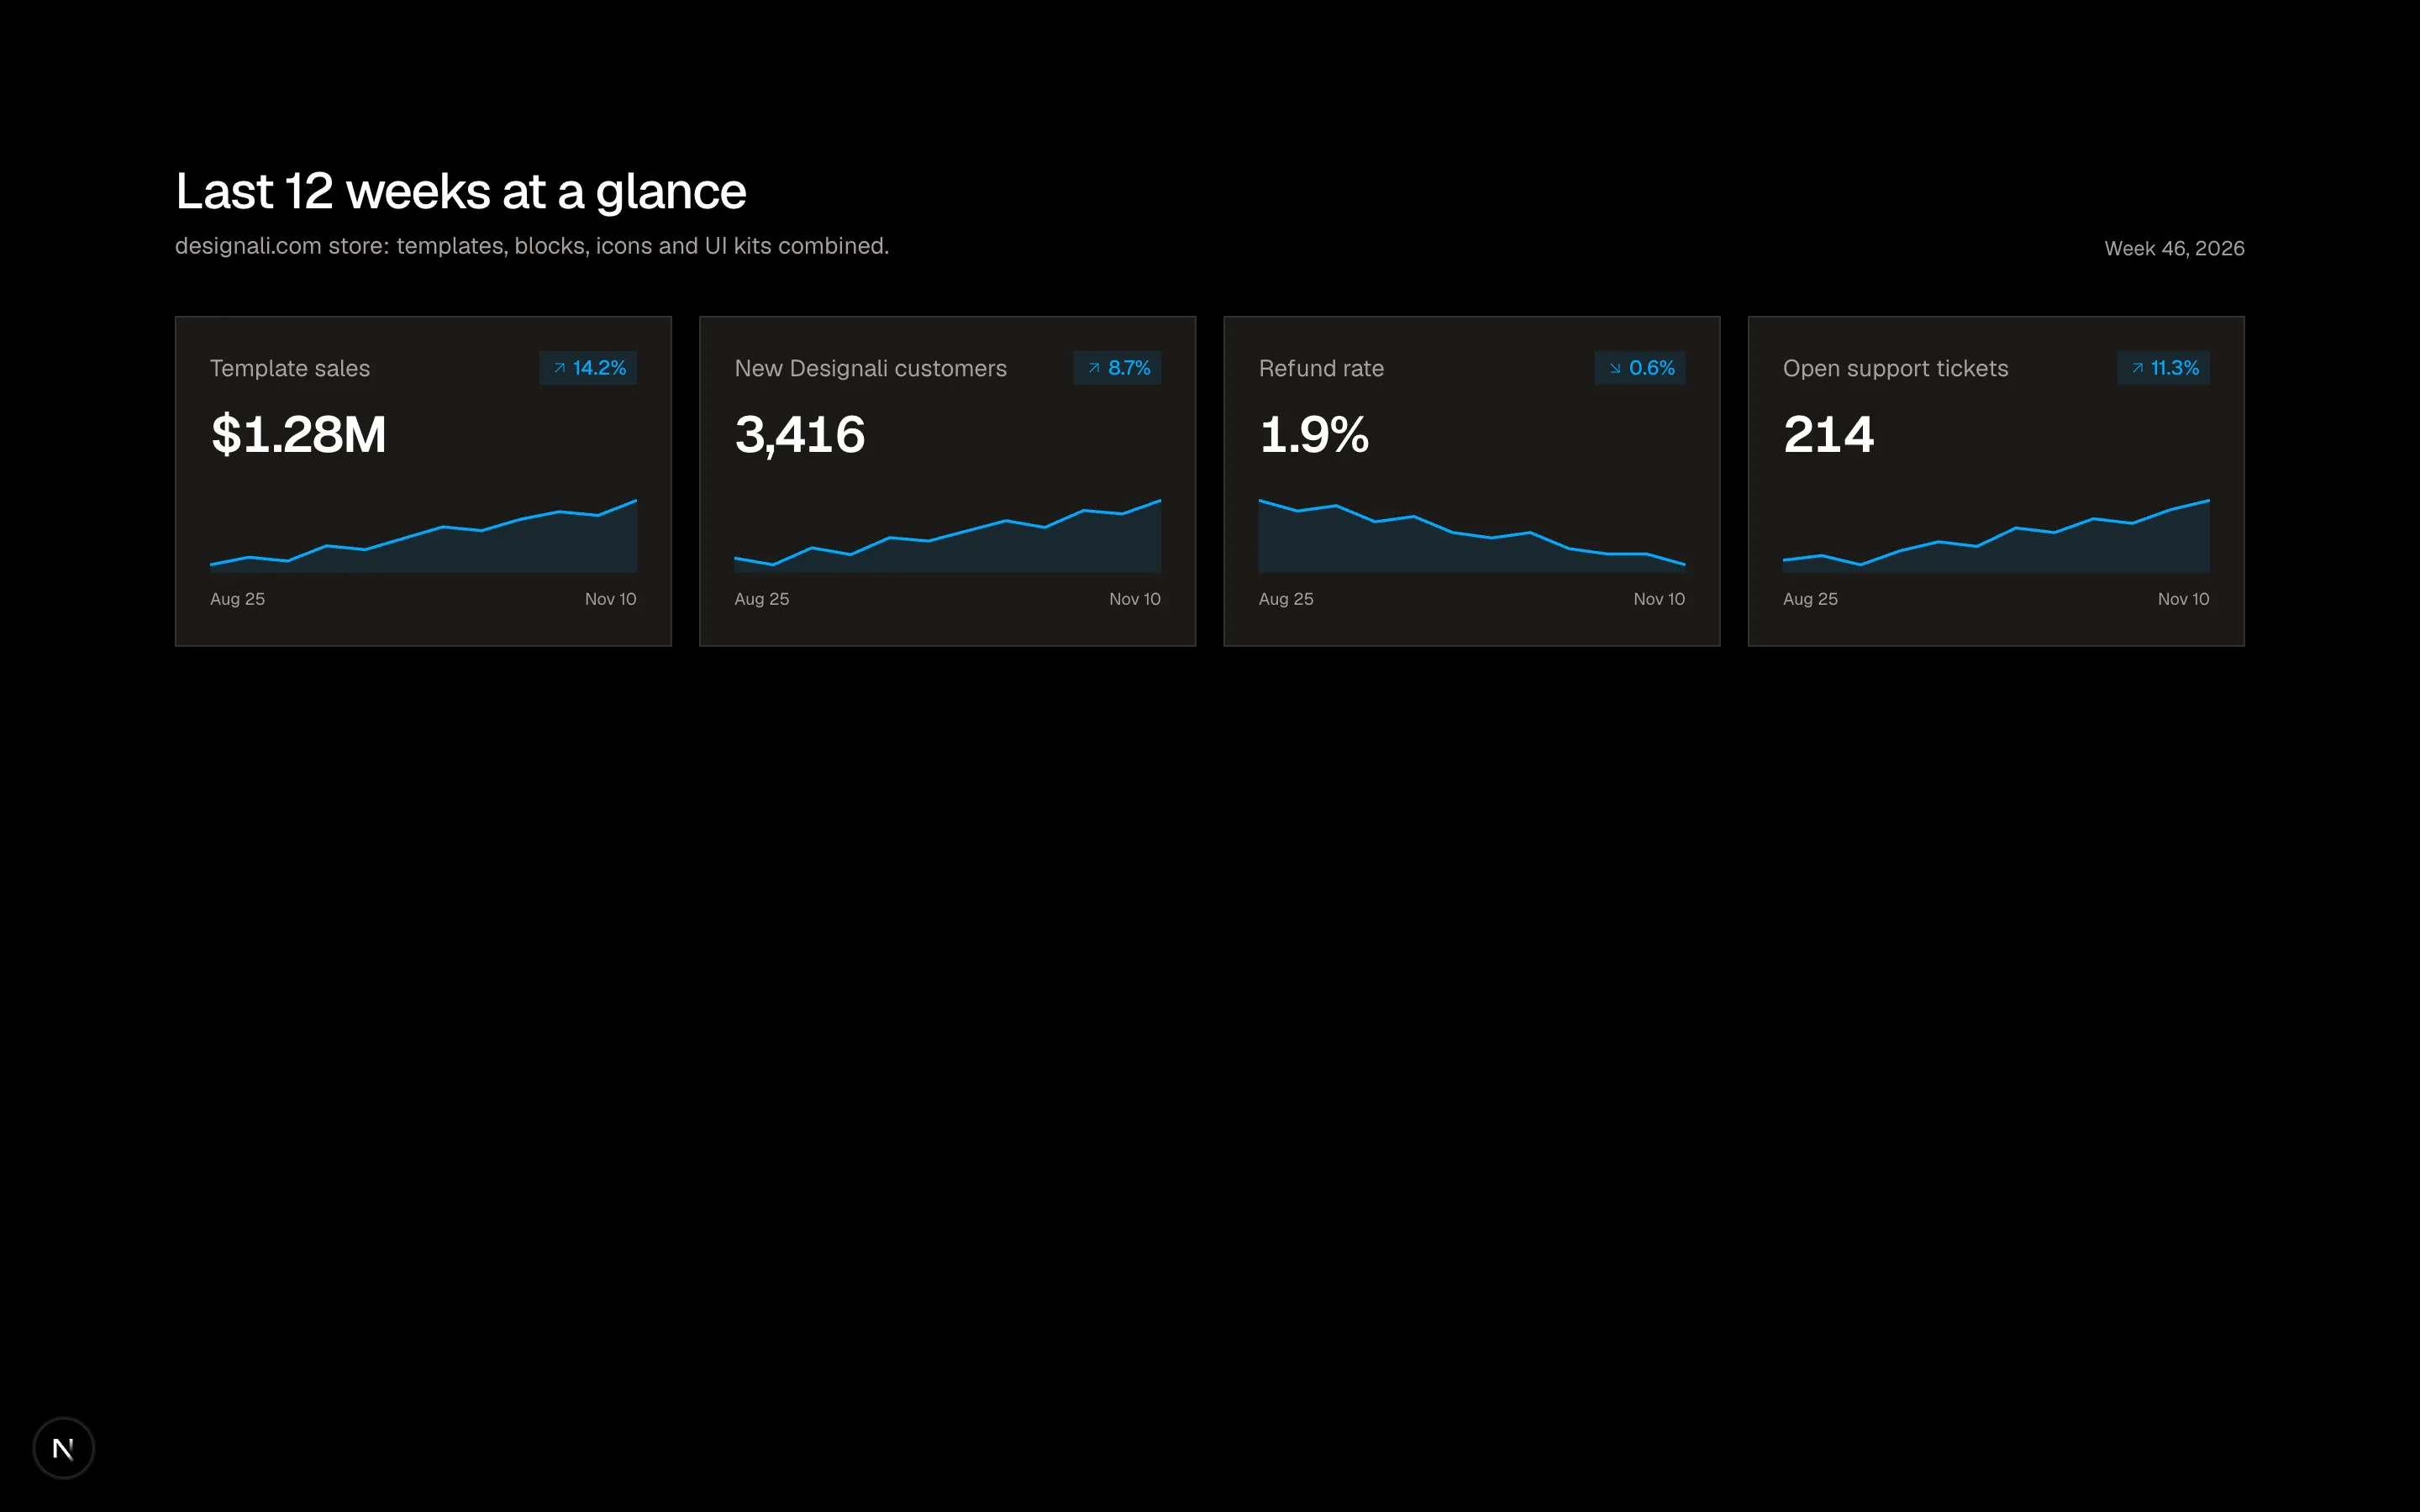
              Last 12 weeks at a glance
            </h2>
            <p className="mt-1 text-sm text-muted-foreground">
              designali.com store: templates, blocks, icons and UI kits combined.
            </p>
          </div>
          <span className="text-xs text-muted-foreground">Week 46, 2026</span>
        </div>

        <div className="grid gap-4 sm:grid-cols-2 lg:grid-cols-4">
          {cards.map((card) => {
            const good = card.inverse ? card.change < 0 : card.change > 0
            return (
              <div key={card.label} className="flex flex-col border bg-card p-5">
                <div className="flex items-center justify-between">
                  <p className="text-sm text-muted-foreground">{card.label}</p>
                  <span
                    className={cn(
                      "inline-flex items-center gap-0.5 px-1.5 py-0.5 text-xs font-medium",
                      good
                        ? "bg-primary/10 text-chart-3 dark:text-primary"
                        : "bg-primary/10 text-chart-3 dark:text-primary"
                    )}
                  >
                    {card.change > 0 ? (
                      <ArrowUpRight className="size-3" />
                    ) : (
                      <ArrowDownRight className="size-3" />
                    )}
                    {Math.abs(card.change)}%
                  </span>
                </div>
                <CounterNumber
                  value={card.value}
                  prefix={card.prefix}
                  suffix={card.suffix}
                  decimalPlaces={card.decimals}
                  className="mt-3 block text-3xl font-semibold tracking-tight"
                />
                <div className="mt-4">
                  <Sparkline data={card.data} positive={good} />
                </div>
                <div className="mt-2 flex justify-between text-[10px] text-muted-foreground">
                  <span>Aug 25</span>
                  <span>Nov 10</span>
                </div>
              </div>
            )
          })}
        </div>
      </div>
    </section>
  )
}
Four KPI cards in a responsive grid, each with a change badge and an inline area sparkline.
analytics-06
Files
"use client"

import { useState } from "react"

import { cn } from "@/lib/utils"

const channels = [
  { key: "organic", label: "Search", color: "var(--chart-1)" },
  { key: "paid", label: "Social", color: "var(--chart-2)" },
  { key: "partner", label: "21st.dev", color: "var(--chart-3)" },
] as const

type ChannelKey = (typeof channels)[number]["key"]

const weeks: { week: string; organic: number; paid: number; partner: number }[] = [
  { week: "W35", organic: 420, paid: 210, partner: 90 },
  { week: "W36", organic: 450, paid: 240, partner: 110 },
  { week: "W37", organic: 430, paid: 280, partner: 100 },
  { week: "W38", organic: 480, paid: 260, partner: 130 },
  { week: "W39", organic: 510, paid: 300, partner: 120 },
  { week: "W40", organic: 540, paid: 320, partner: 150 },
  { week: "W41", organic: 520, paid: 290, partner: 170 },
  { week: "W42", organic: 580, paid: 340, partner: 160 },
  { week: "W43", organic: 610, paid: 360, partner: 190 },
  { week: "W44", organic: 640, paid: 330, partner: 210 },
  { week: "W45", organic: 690, paid: 380, partner: 220 },
  { week: "W46", organic: 720, paid: 410, partner: 240 },
]

export function Analytics07() {
  const [enabled, setEnabled] = useState<ChannelKey[]>(["organic", "paid", "partner"])
  const [hover, setHover] = useState<number | null>(null)

  const totals = weeks.map((w) => enabled.reduce((sum, k) => sum + w[k], 0))
  const max = Math.max(...totals, 1)
  const active = hover !== null ? weeks[hover] : undefined

  function toggle(key: ChannelKey) {
    setEnabled((prev) =>
      prev.includes(key)
        ? prev.length > 1
          ? prev.filter((k) => k !== key)
          : prev
        : [...prev, key]
    )
  }

  return (
    <section className="w-full bg-background py-16 text-foreground md:py-24">
      <div className="mx-auto max-w-7xl px-6">
        <div className="border bg-card p-6 md:p-8">
          <div className="flex flex-col gap-6 md:flex-row md:items-start md:justify-between">
            <div>
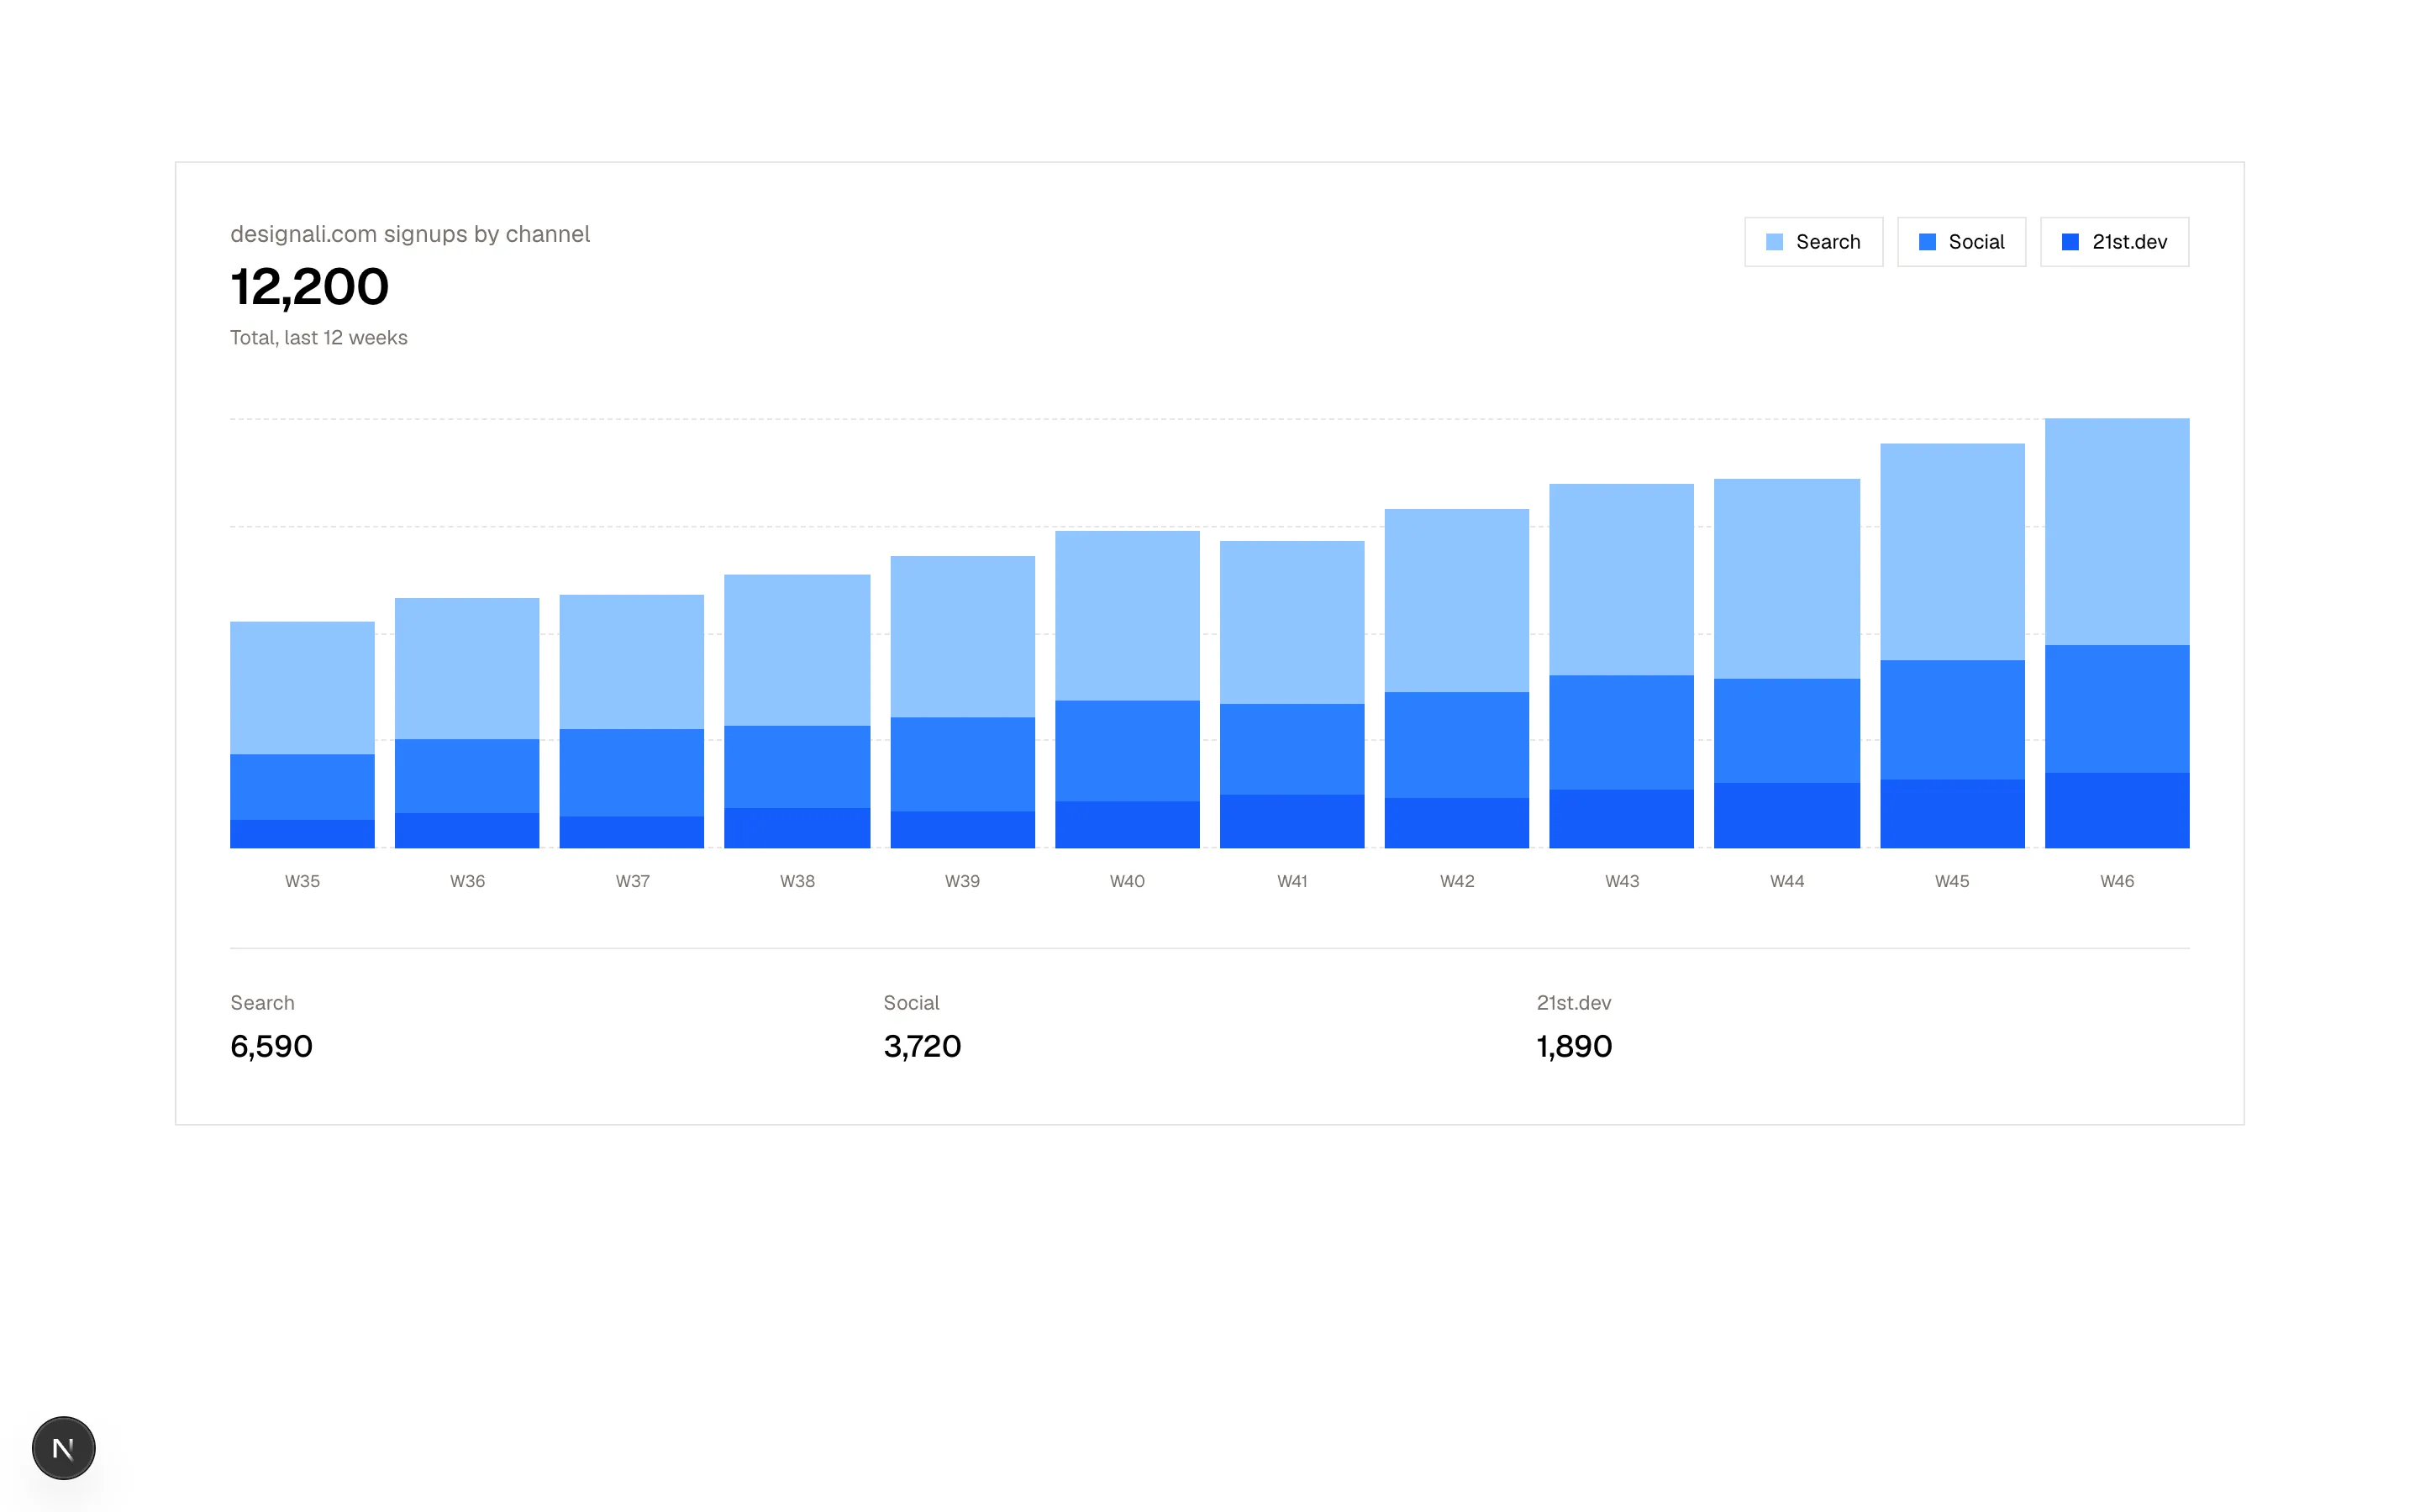
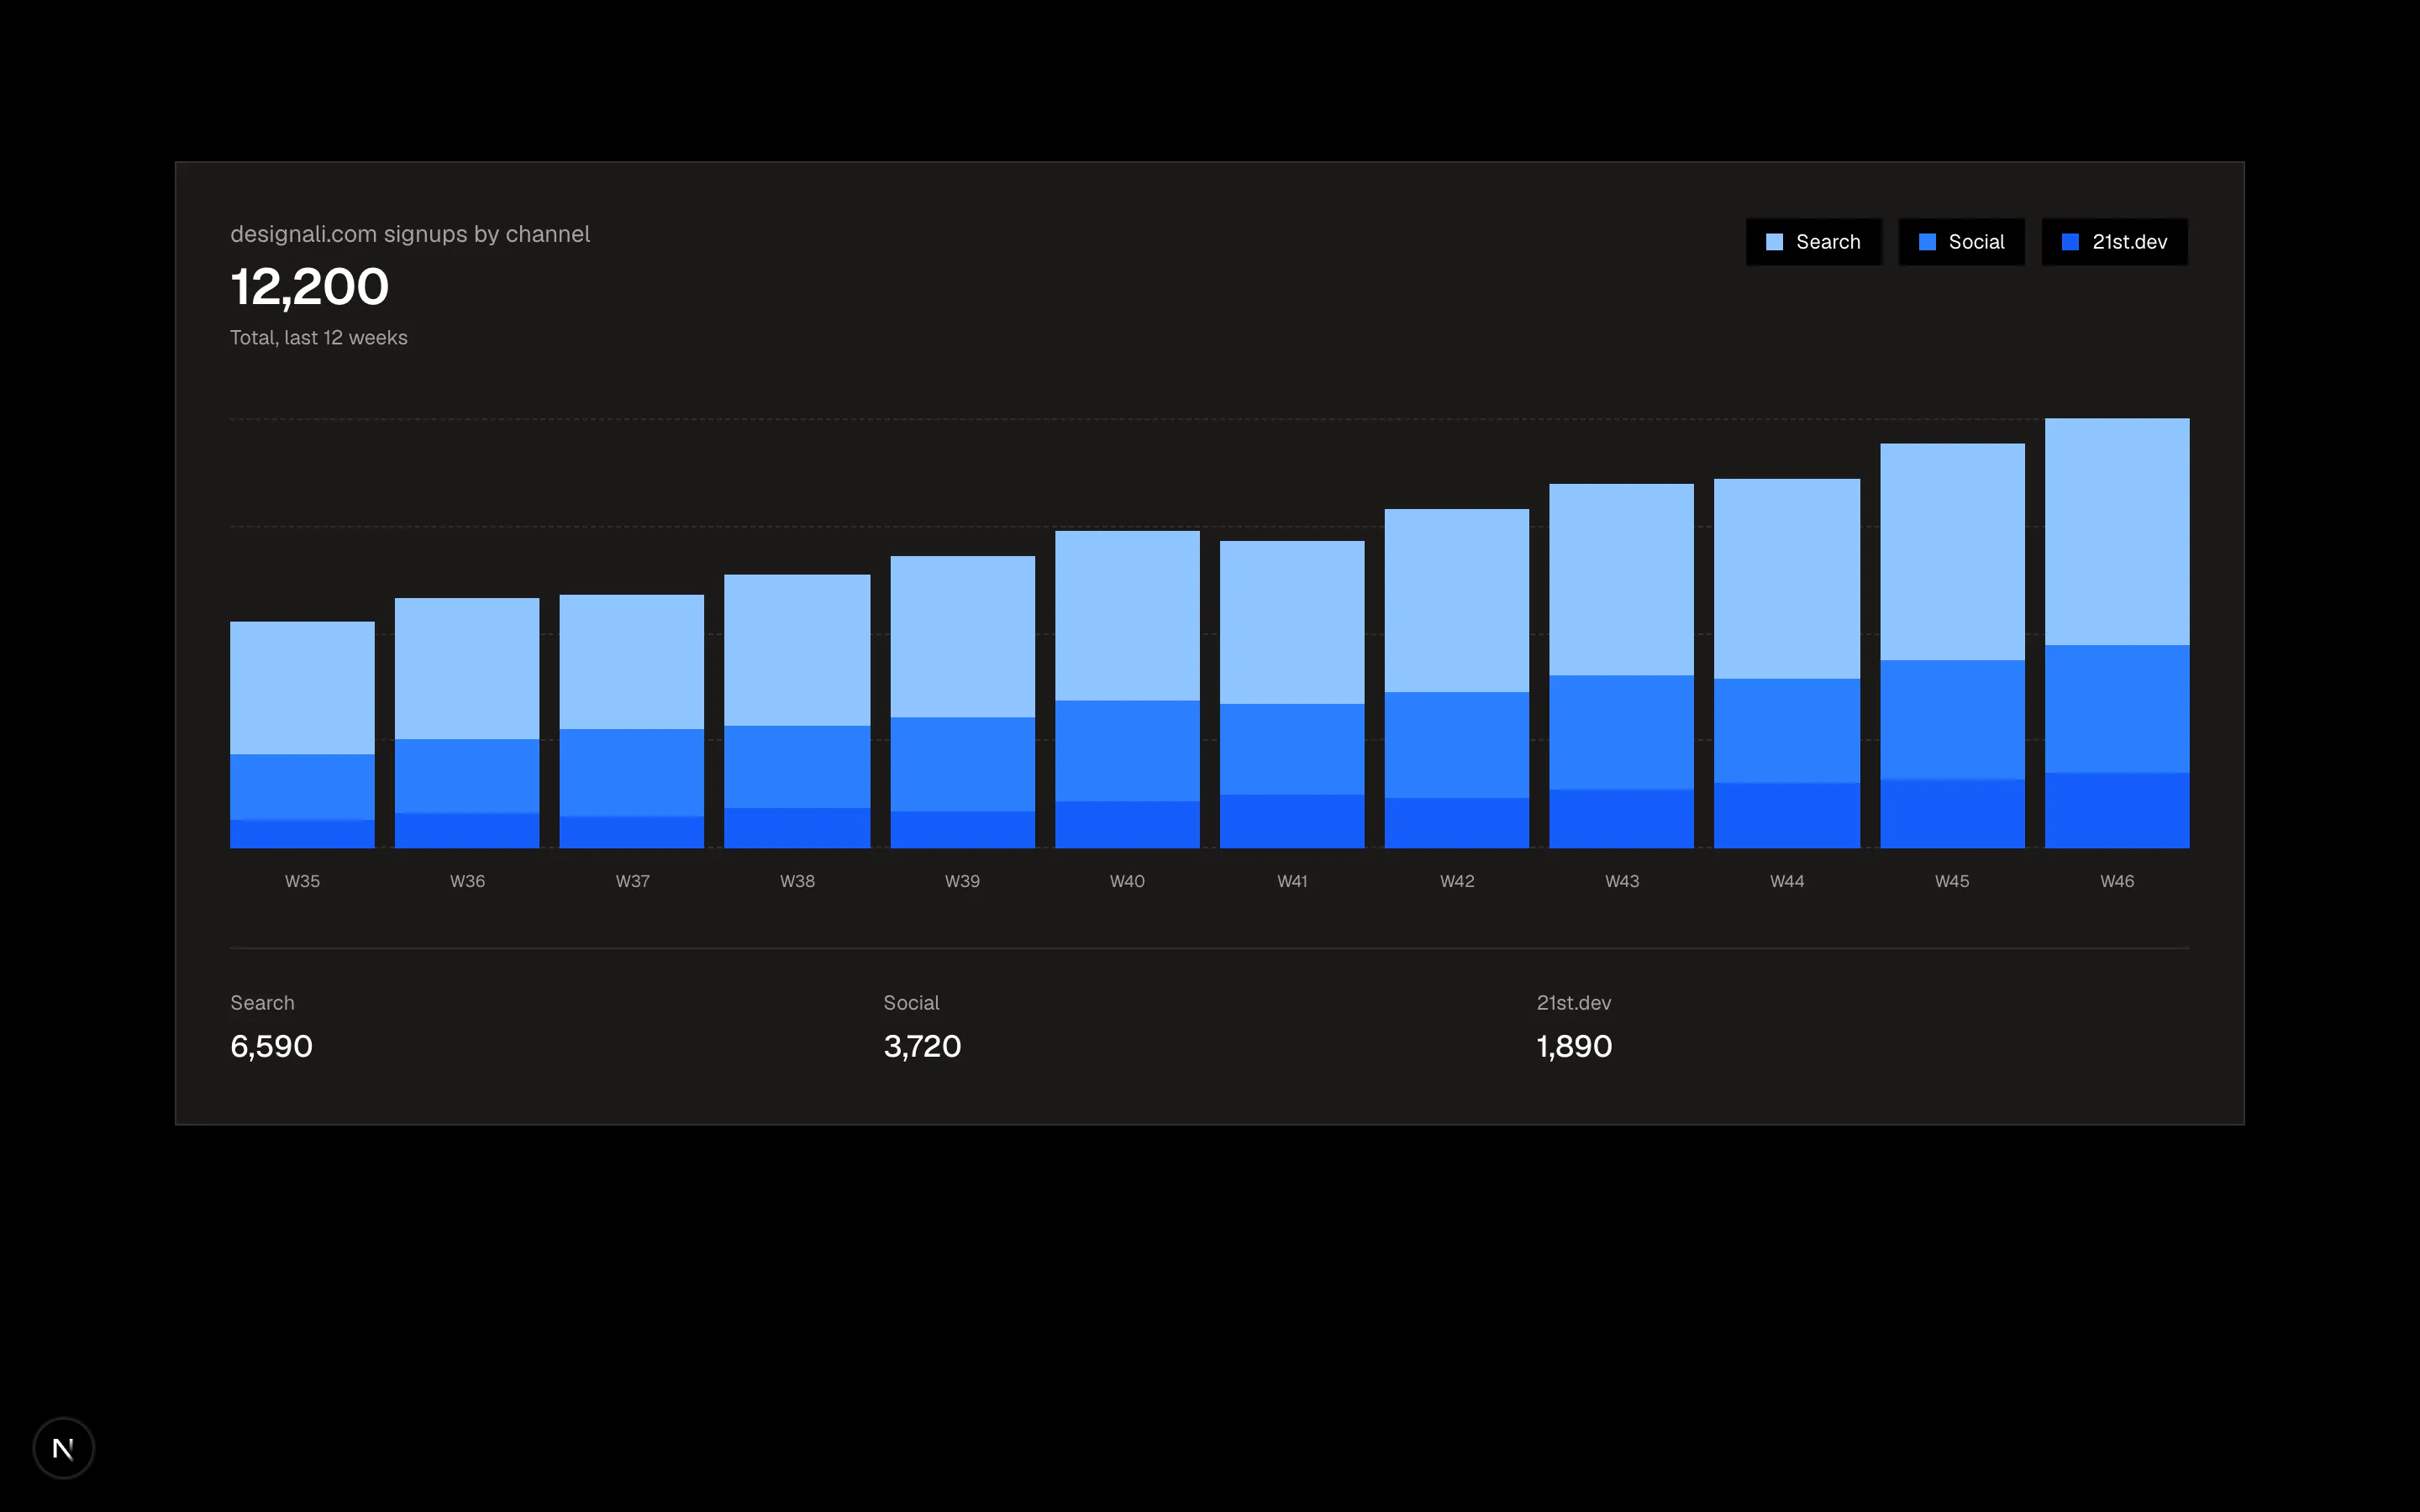
              <p className="text-sm text-muted-foreground">designali.com signups by channel</p>
              <p className="mt-1 text-3xl font-semibold tracking-tight">
                {(active
                  ? enabled.reduce((s, k) => s + active[k], 0)
                  : totals.reduce((s, v) => s + v, 0)
                ).toLocaleString()}
              </p>
              <p className="mt-1 text-xs text-muted-foreground">
                {active ? `Week ${active.week.slice(1)}` : "Total, last 12 weeks"}
              </p>
            </div>
            <div className="flex flex-wrap gap-2">
              {channels.map((c) => {
                const on = enabled.includes(c.key)
                return (
                  <button
                    key={c.key}
                    type="button"
                    onClick={() => toggle(c.key)}
                    aria-pressed={on}
                    className={cn(
                      "inline-flex items-center gap-2 border px-3 py-1.5 text-xs transition-colors",
                      on ? "bg-background text-foreground" : "text-muted-foreground opacity-60"
                    )}
                  >
                    <span className="size-2.5" style={{ background: c.color }} />
                    {c.label}
                  </button>
                )
              })}
            </div>
          </div>

          <div
            className="relative mt-10 flex h-64 items-end gap-1.5 sm:gap-3"
            onMouseLeave={() => setHover(null)}
          >
            <div className="pointer-events-none absolute inset-0 flex flex-col justify-between">
              {[0, 1, 2, 3, 4].map((i) => (
                <div key={i} className="border-t border-dashed border-border" />
              ))}
            </div>
            {weeks.map((w, i) => (
              <div
                key={w.week}
                onMouseEnter={() => setHover(i)}
                className={cn(
                  "relative flex h-full flex-1 flex-col justify-end transition-opacity",
                  hover !== null && hover !== i && "opacity-40"
                )}
              >
                {channels
                  .filter((c) => enabled.includes(c.key))
                  .map((c) => (
                    <div
                      key={c.key}
                      style={{ height: `${(w[c.key] / max) * 100}%`, background: c.color }}
                      className="w-full transition-[height] duration-300"
                    />
                  ))}
              </div>
            ))}
          </div>
          <div className="mt-3 flex gap-1.5 text-center text-[10px] text-muted-foreground sm:gap-3">
            {weeks.map((w, i) => (
              <span key={w.week} className={cn("flex-1", i % 2 === 1 && "hidden sm:block")}>
                {w.week}
              </span>
            ))}
          </div>

          <div className="mt-8 grid grid-cols-3 border-t pt-6">
            {channels.map((c) => (
              <div key={c.key}>
                <p className="text-xs text-muted-foreground">{c.label}</p>
                <p className="mt-1 text-lg font-medium">
                  {(active ? active[c.key] : weeks.reduce((s, w) => s + w[c.key], 0)).toLocaleString()}
                </p>
              </div>
            ))}
          </div>
        </div>
      </div>
    </section>
  )
}
Interactive stacked bar chart of signups by channel with toggleable legend chips and hover-to-inspect weekly totals.
analytics-07
Files
import {
  Gauge,
  GaugeIndicator,
  GaugeRange,
  GaugeTrack,
  GaugeValueText,
} from "@/components/ui/gauge"

const gauges = [
  { name: "designali.com availability", value: 99.97, target: 99.95, unit: "%", min: 99, max: 100 },
  { name: "Checkout latency p95", value: 412, target: 500, unit: "ms", min: 0, max: 800, lowerIsBetter: true },
  { name: "Error budget left", value: 63, target: 25, unit: "%", min: 0, max: 100 },
]

export function Analytics08() {
  return (
    <section className="w-full bg-muted/40 py-16 text-foreground md:py-24">
      <div className="mx-auto max-w-7xl px-6">
        <div className="mx-auto max-w-2xl text-center">
          <p className="text-xs tracking-widest text-muted-foreground uppercase">
            Service level objectives
          </p>
          <h2 className="mt-3 text-3xl font-medium tracking-tight md:text-4xl">
            designali.com reliability, rolling 30 days
          </h2>
          <p className="mt-4 text-muted-foreground">
            Every objective is measured at the Vercel edge and published to
            Designali customers without smoothing or exclusions.
          </p>
        </div>

        <div className="mt-14 grid gap-6 md:grid-cols-3">
          {gauges.map((g) => {
            const ok = g.lowerIsBetter ? g.value <= g.target : g.value >= g.target
            return (
              <div key={g.name} className="flex flex-col items-center border bg-background p-8">
                <Gauge
                  value={g.value}
                  min={g.min}
                  max={g.max}
                  size={200}
                  startAngle={-135}
                  endAngle={135}
                  className="max-w-full"
                >
                  <GaugeIndicator>
                    <GaugeTrack />
                    <GaugeRange className="text-primary" />
                  </GaugeIndicator>
                  <GaugeValueText className="flex-col">
                    <span className="text-3xl font-semibold tracking-tight">
                      {g.value}
                      <span className="text-base font-normal text-muted-foreground">{g.unit}</span>
                    </span>
                  </GaugeValueText>
                </Gauge>
                <div className="mt-2 flex w-full max-w-[240px] justify-between text-[10px] text-muted-foreground">
                  <span>
                    {g.min}
                    {g.unit}
                  </span>
                  <span>
                    {g.max}
                    {g.unit}
                  </span>
                </div>
                <p className="mt-6 font-medium">{g.name}</p>
                <p className="mt-1 text-xs text-muted-foreground">
                  Target {g.lowerIsBetter ? "under" : "above"} {g.target}
                  {g.unit}
                </p>
                <span
                  className={
                    ok
                      ? "mt-4 bg-primary/10 px-2 py-1 text-xs text-chart-3 dark:text-primary"
                      : "mt-4 bg-primary/10 px-2 py-1 text-xs text-chart-3 dark:text-primary"
                  }
                >
                  {ok ? "Meeting objective" : "At risk"}
                </span>
              </div>
            )
          })}
        </div>
      </div>
    </section>
  )
}
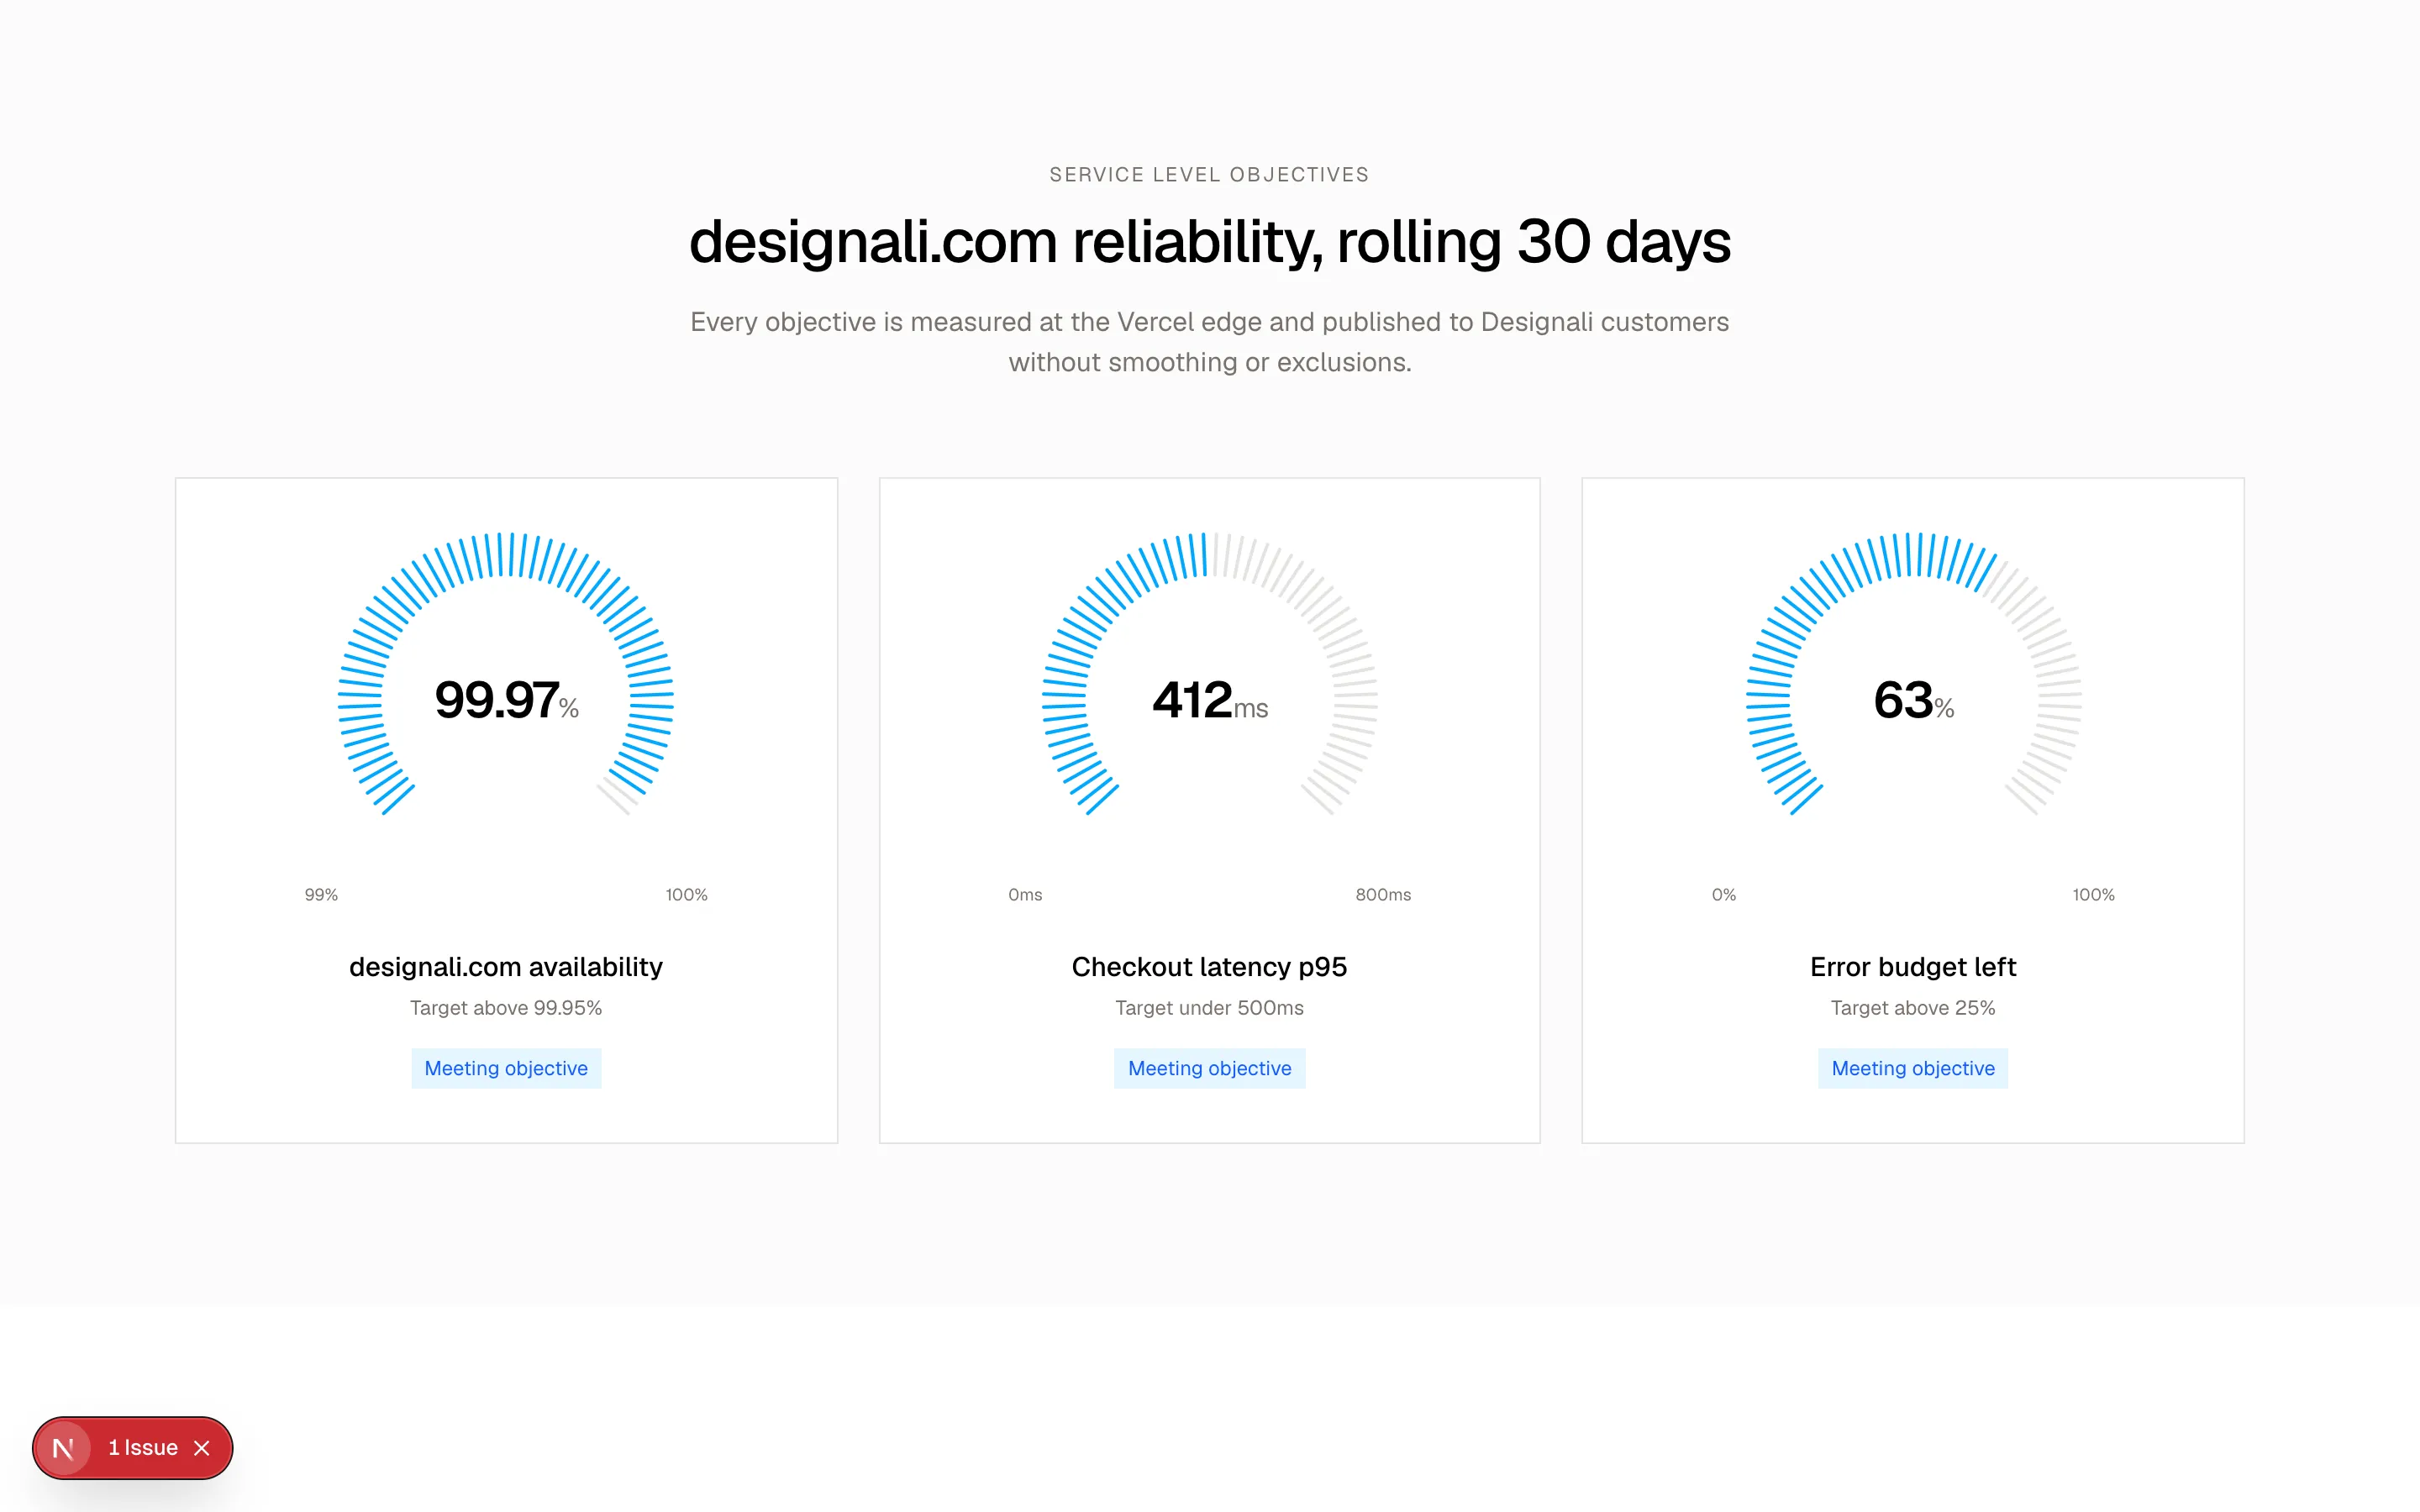
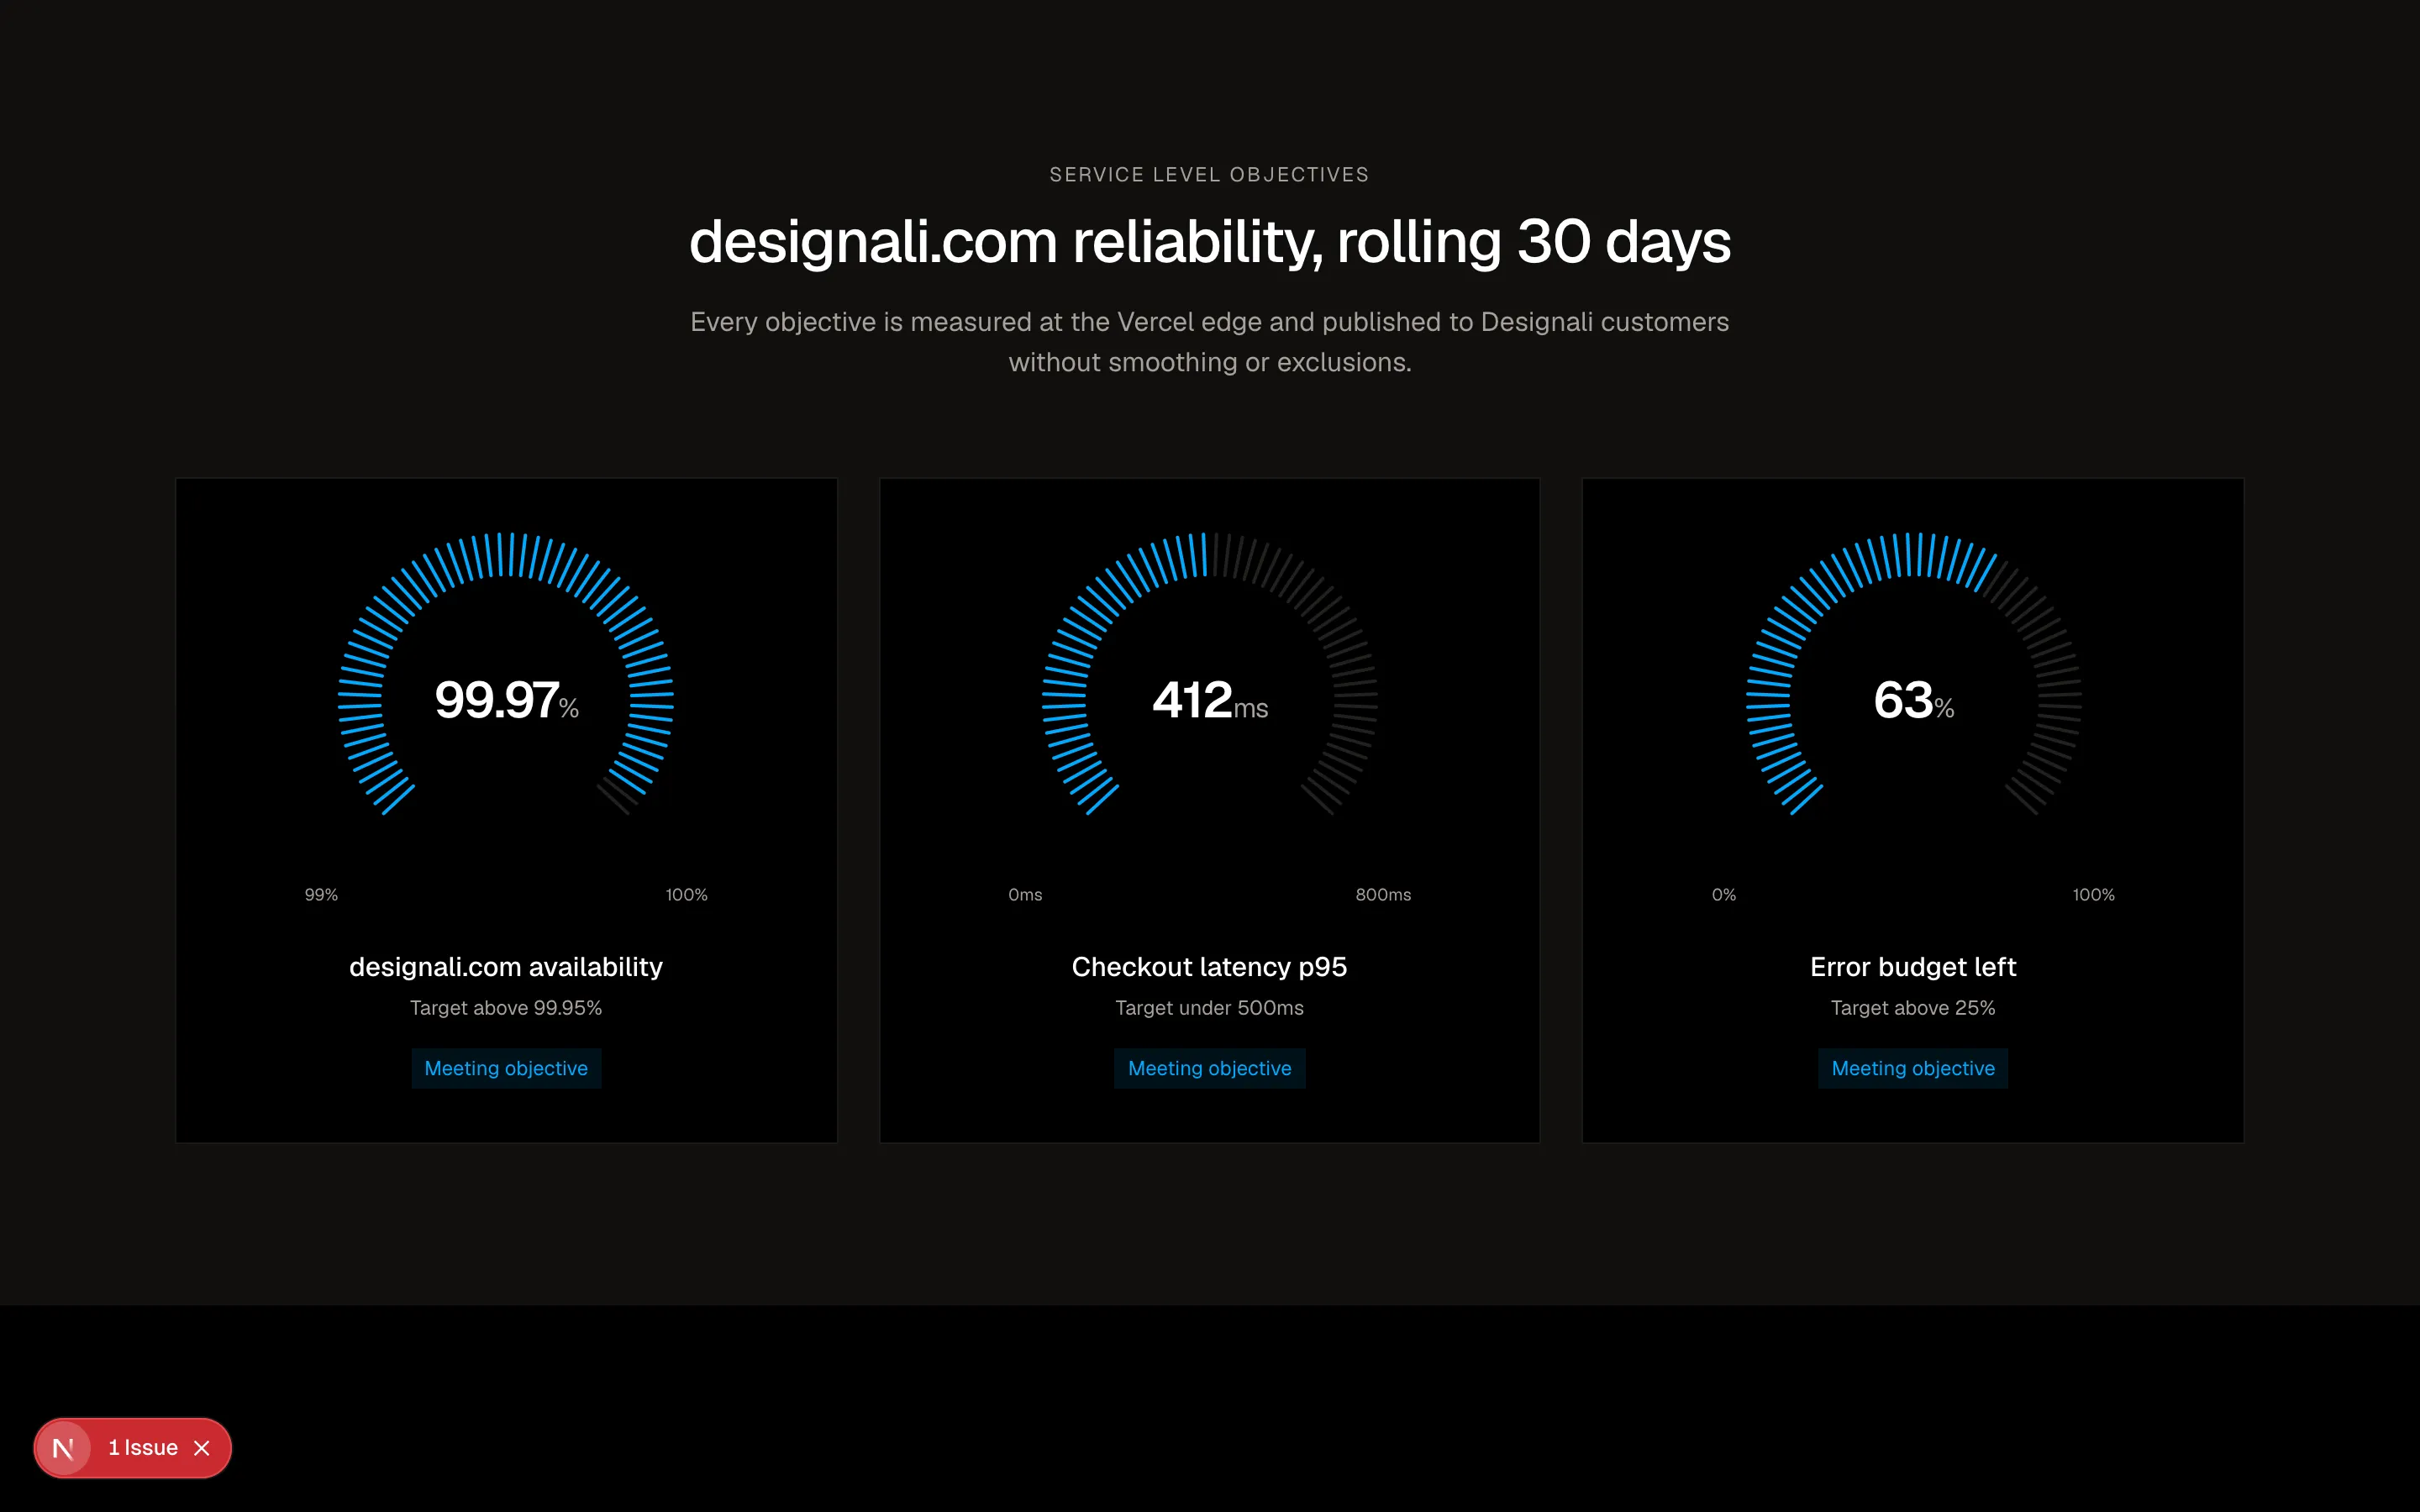
Centered SLO header above three semicircle gauge cards showing value, target and status.
analytics-08
Files
import { CounterNumber } from "@/components/ui/counter-number"

const cohorts = [
  { month: "May 2026", size: 1240, retention: [100, 72, 61, 55, 51, 48, 46] },
  { month: "Jun 2026", size: 1385, retention: [100, 74, 63, 57, 53, 50] },
  { month: "Jul 2026", size: 1512, retention: [100, 76, 66, 60, 56] },
  { month: "Aug 2026", size: 1460, retention: [100, 78, 68, 62] },
  { month: "Sep 2026", size: 1698, retention: [100, 81, 71] },
  { month: "Oct 2026", size: 1874, retention: [100, 83] },
  { month: "Nov 2026", size: 902, retention: [100] },
]

const periods = 7

function cellStyle(value: number) {
  const alpha = 0.08 + (value / 100) * 0.82
  return {
    background: `color-mix(in oklch, var(--chart-1) ${Math.round(alpha * 100)}%, transparent)`,
  }
}

export function Analytics09() {
  return (
    <section className="w-full bg-background py-16 text-foreground md:py-24">
      <div className="mx-auto max-w-7xl px-6">
        <div className="grid gap-10 lg:grid-cols-[1fr_2.4fr]">
          <div>
            <p className="text-xs tracking-widest text-muted-foreground uppercase">
              Retention
            </p>
            <h2 className="mt-2 text-3xl font-medium tracking-tight">
              Designali Pro members are sticking longer
            </h2>
            <p className="mt-4 text-sm leading-6 text-muted-foreground">
              Since the new /docs onboarding launched in July, month-one retention
              has climbed from 72% to 83%. Each row is the share of a Designali Pro
              cohort still active after N months.
            </p>
            <dl className="mt-8 grid grid-cols-2 gap-px border bg-border">
              <div className="bg-background p-4">
                <dt className="text-xs text-muted-foreground">M1 retention</dt>
                <dd className="mt-1">
                  <CounterNumber value={83} suffix="%" className="text-2xl font-semibold" />
                </dd>
              </div>
              <div className="bg-background p-4">
                <dt className="text-xs text-muted-foreground">M3 retention</dt>
                <dd className="mt-1">
                  <CounterNumber value={62} suffix="%" className="text-2xl font-semibold" />
                </dd>
              </div>
            </dl>
          </div>

          <div className="min-w-0 overflow-x-auto border">
            <table className="w-full min-w-[560px] border-collapse text-xs">
              <thead>
                <tr className="border-b bg-muted/50 text-muted-foreground">
                  <th className="px-3 py-3 text-left font-medium">Cohort</th>
                  <th className="px-3 py-3 text-right font-medium">Members</th>
                  {Array.from({ length: periods }, (_, i) => (
                    <th key={i} className="px-1 py-3 text-center font-medium">
                      M{i}
                    </th>
                  ))}
                </tr>
              </thead>
              <tbody>
                {cohorts.map((c) => (
                  <tr key={c.month} className="border-b last:border-b-0">
                    <td className="px-3 py-2 font-medium whitespace-nowrap">{c.month}</td>
                    <td className="px-3 py-2 text-right font-sans text-muted-foreground">
                      {c.size.toLocaleString()}
                    </td>
                    {Array.from({ length: periods }, (_, i) => {
                      const v = c.retention[i]
                      return (
                        <td key={i} className="p-0.5">
                          {v !== undefined ? (
                            <div
                              style={cellStyle(v)}
                              className="flex h-9 items-center justify-center font-sans text-foreground"
                            >
                              {v}%
                            </div>
                          ) : (
                            <div className="h-9 bg-muted/30" />
                          )}
                        </td>
                      )
                    })}
                  </tr>
                ))}
              </tbody>
            </table>
          </div>
        </div>
      </div>
    </section>
  )
}
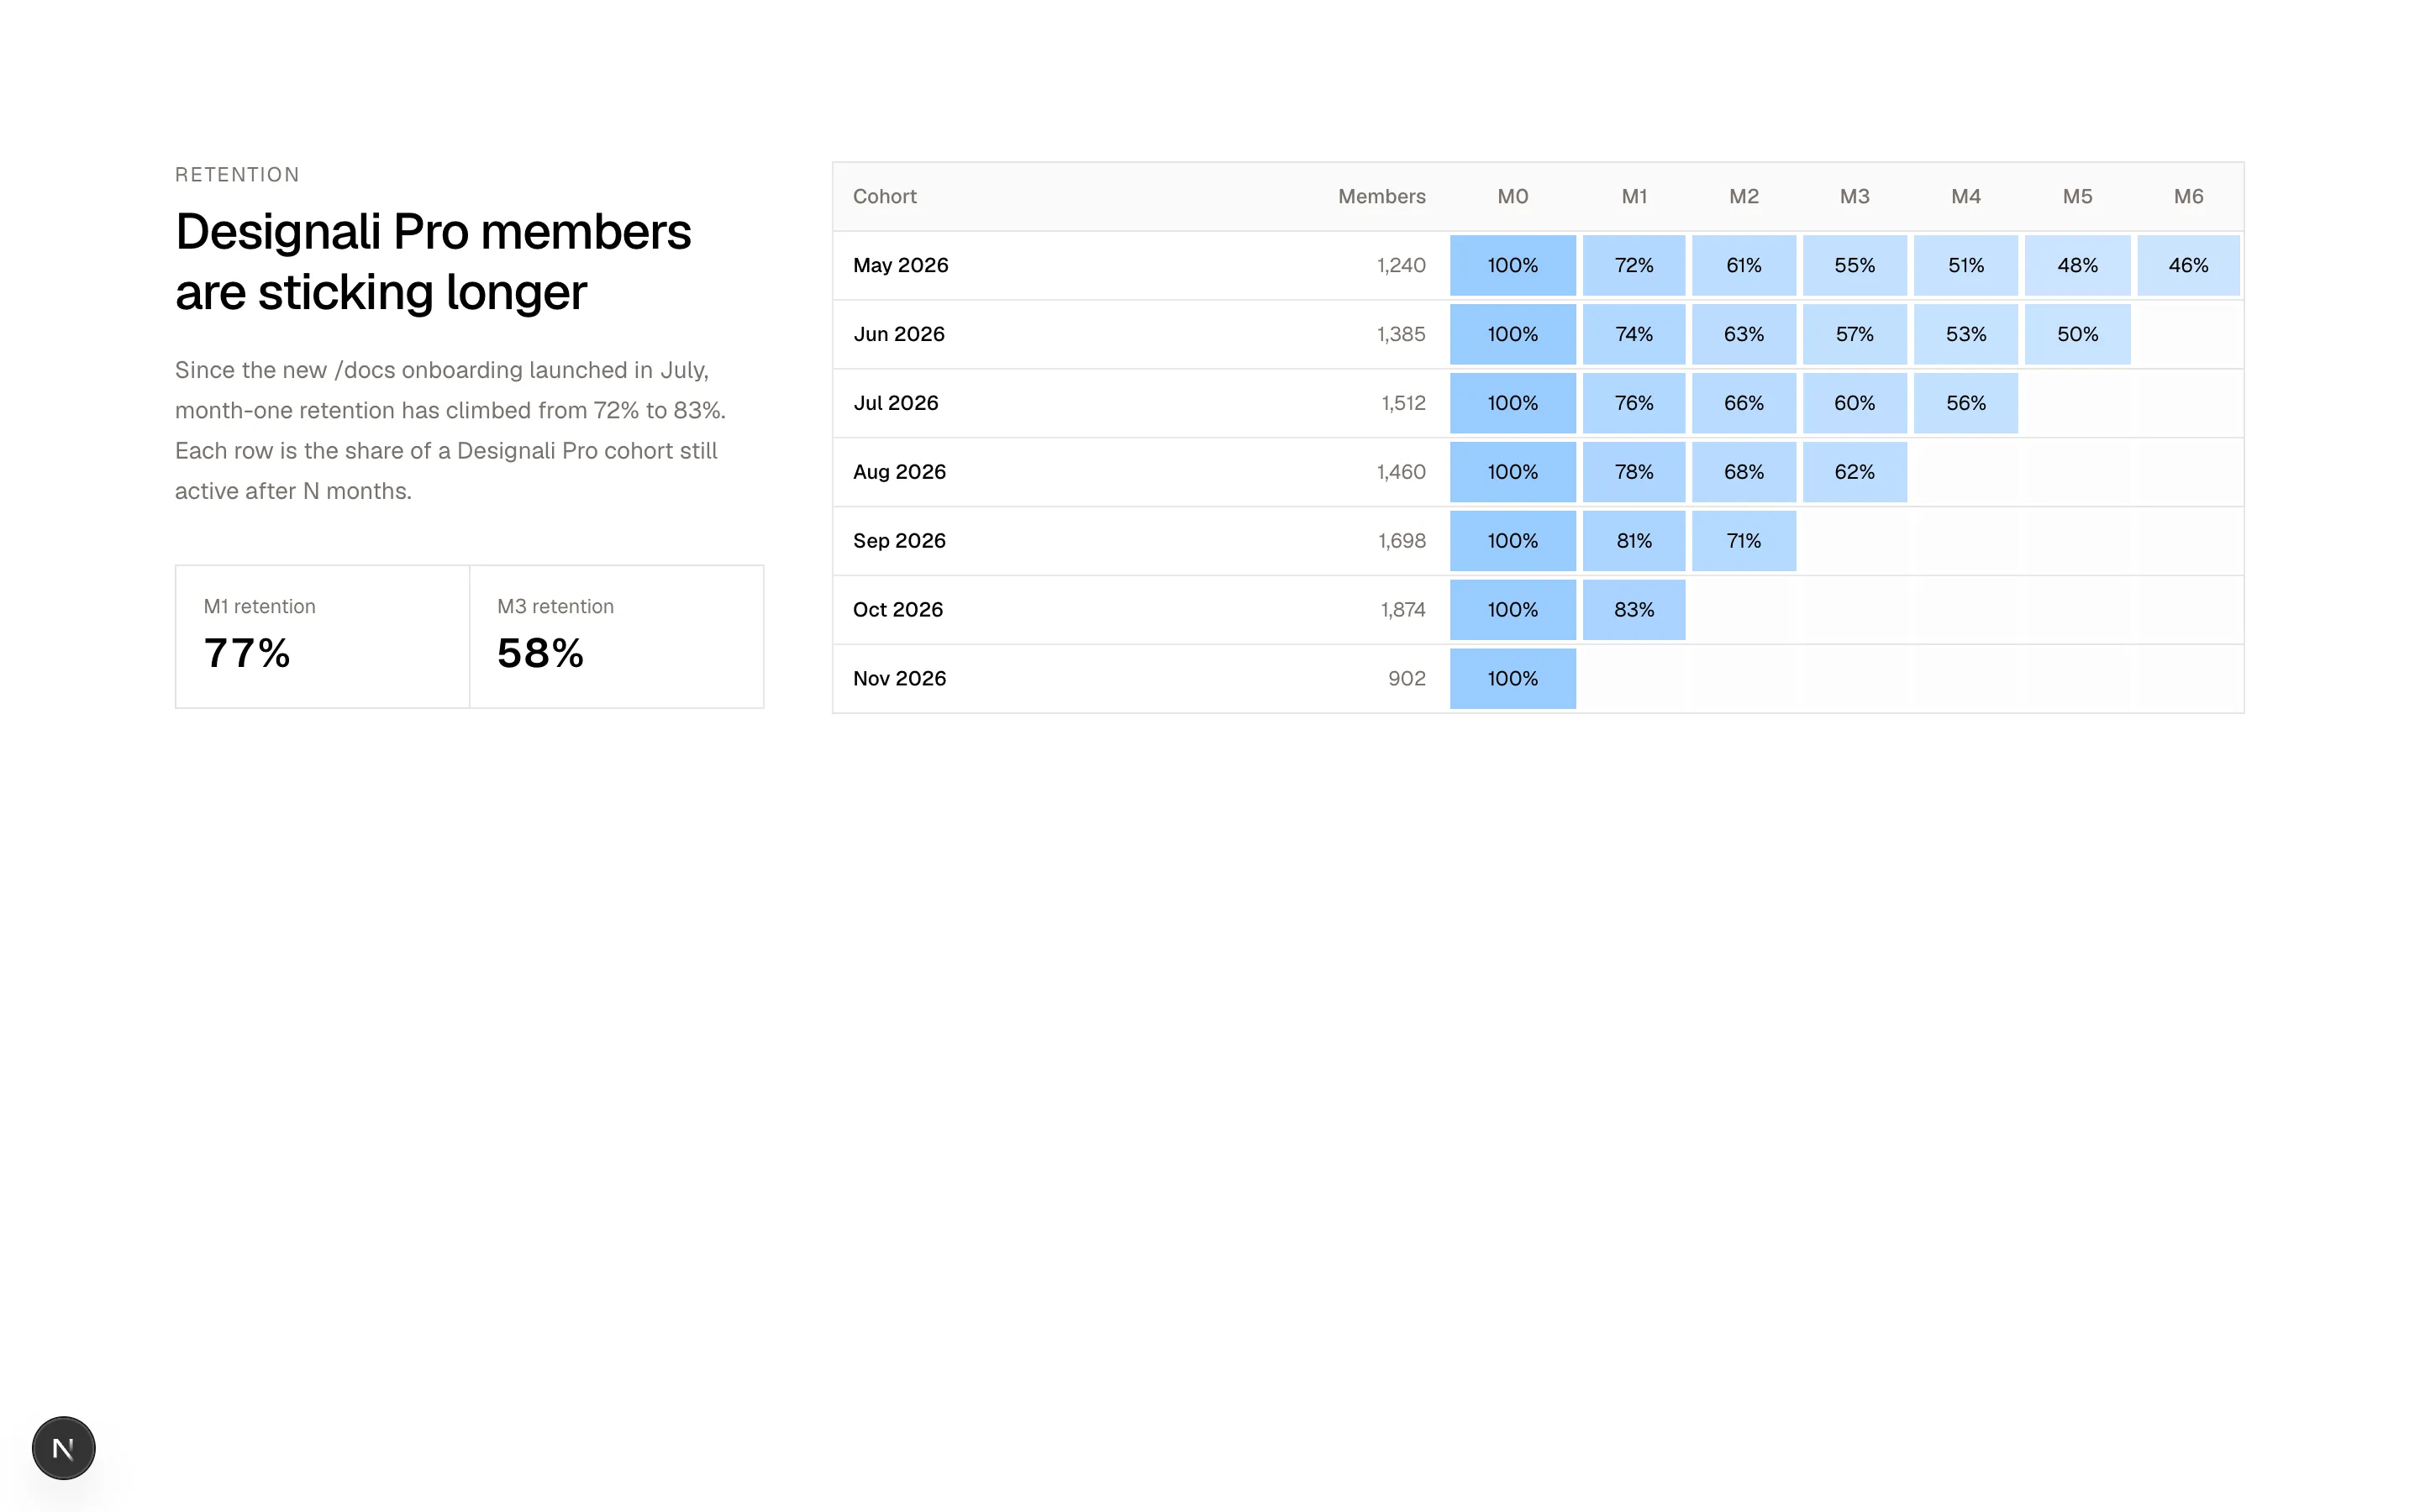
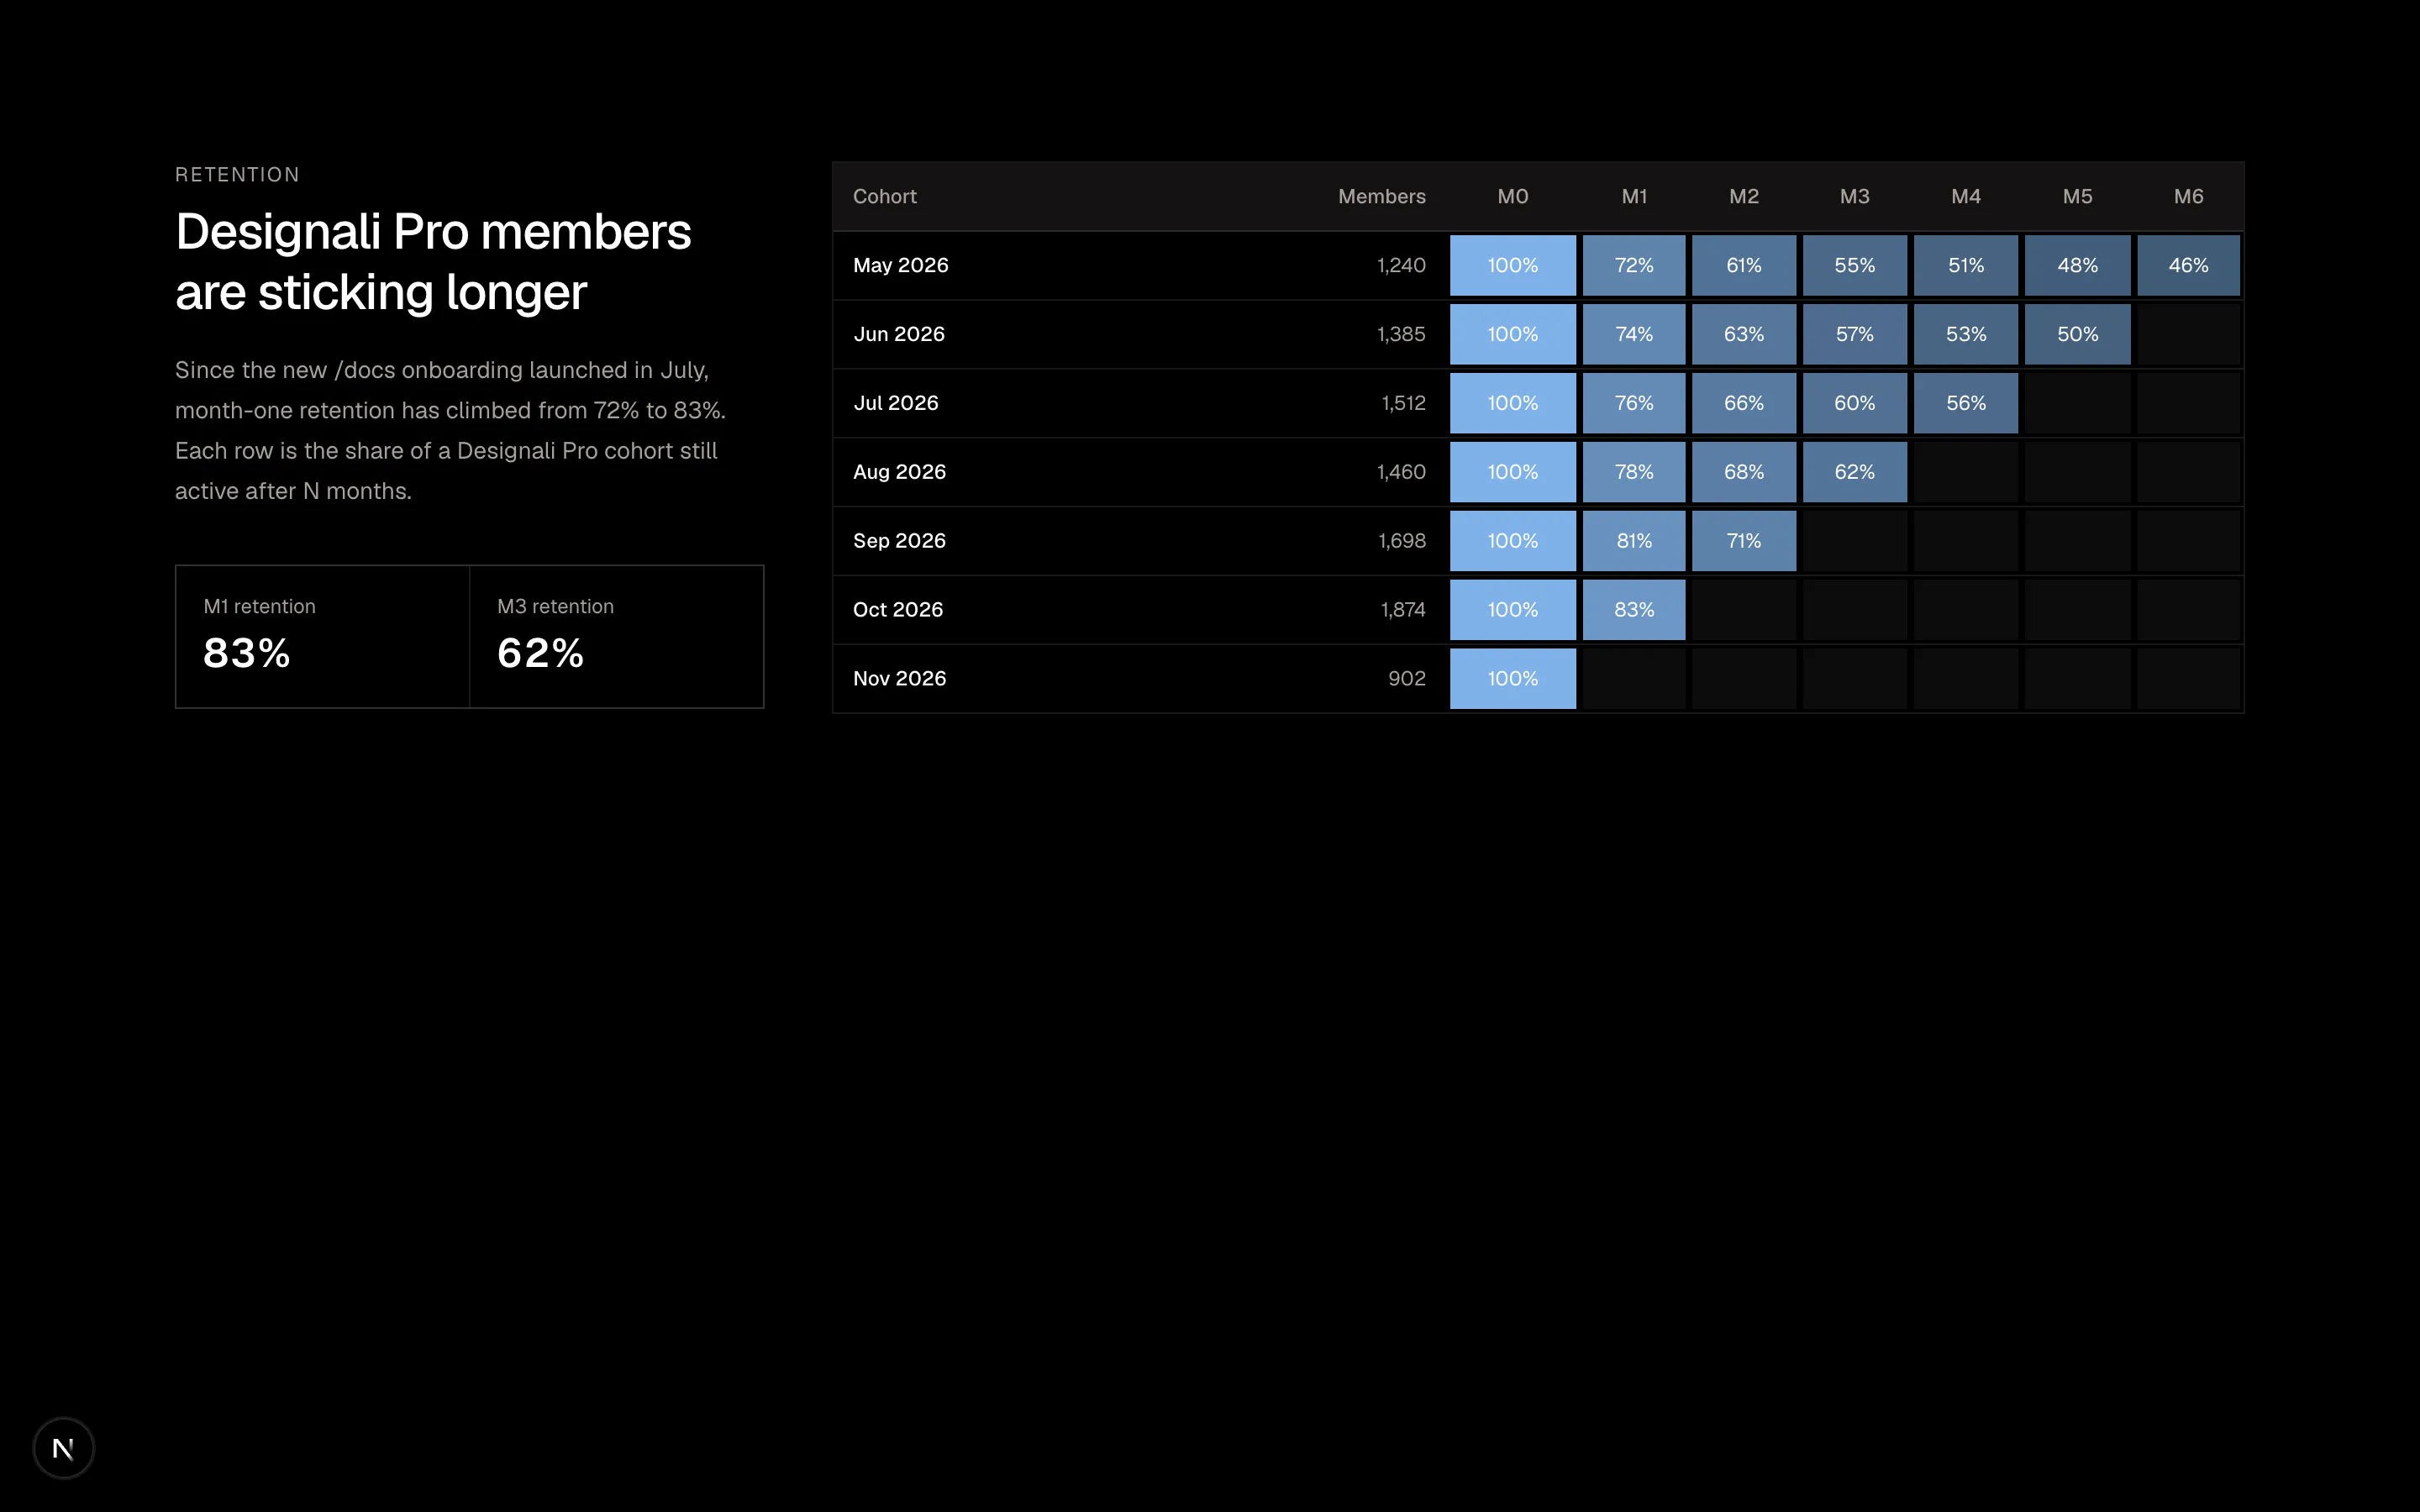
Split layout with retention narrative and summary stats beside a color-scaled monthly cohort retention table.
analytics-09
Files
import {
  Globe,
} from "@designali/icons"

import { CounterNumber } from "@/components/ui/counter-number"

const regions = [
  { code: "US", name: "United States", visitors: 182400, change: 6.2 },
  { code: "DE", name: "Germany", visitors: 74210, change: 11.8 },
  { code: "GB", name: "United Kingdom", visitors: 61980, change: 3.4 },
  { code: "IN", name: "India", visitors: 58320, change: 24.1 },
  { code: "BR", name: "Brazil", visitors: 39150, change: 17.5 },
  { code: "JP", name: "Japan", visitors: 27640, change: -2.3 },
  { code: "CA", name: "Canada", visitors: 24410, change: 4.9 },
]

const continents = [
  { name: "North America", share: 41 },
  { name: "Europe", share: 32 },
  { name: "Asia Pacific", share: 18 },
  { name: "Latin America", share: 7 },
  { name: "Africa", share: 2 },
]

export function Analytics10() {
  const top = regions[0]?.visitors ?? 1
  const total = regions.reduce((s, r) => s + r.visitors, 0)

  return (
    <section className="w-full bg-background py-16 text-foreground md:py-24">
      <div className="mx-auto max-w-7xl px-6">
        <div className="grid gap-px border bg-border lg:grid-cols-[1fr_1.6fr]">
        <div className="flex flex-col justify-between gap-10 bg-background p-6 md:p-10">
          <div>
            <span className="flex size-10 items-center justify-center border">
              <Globe className="size-4" />
            </span>
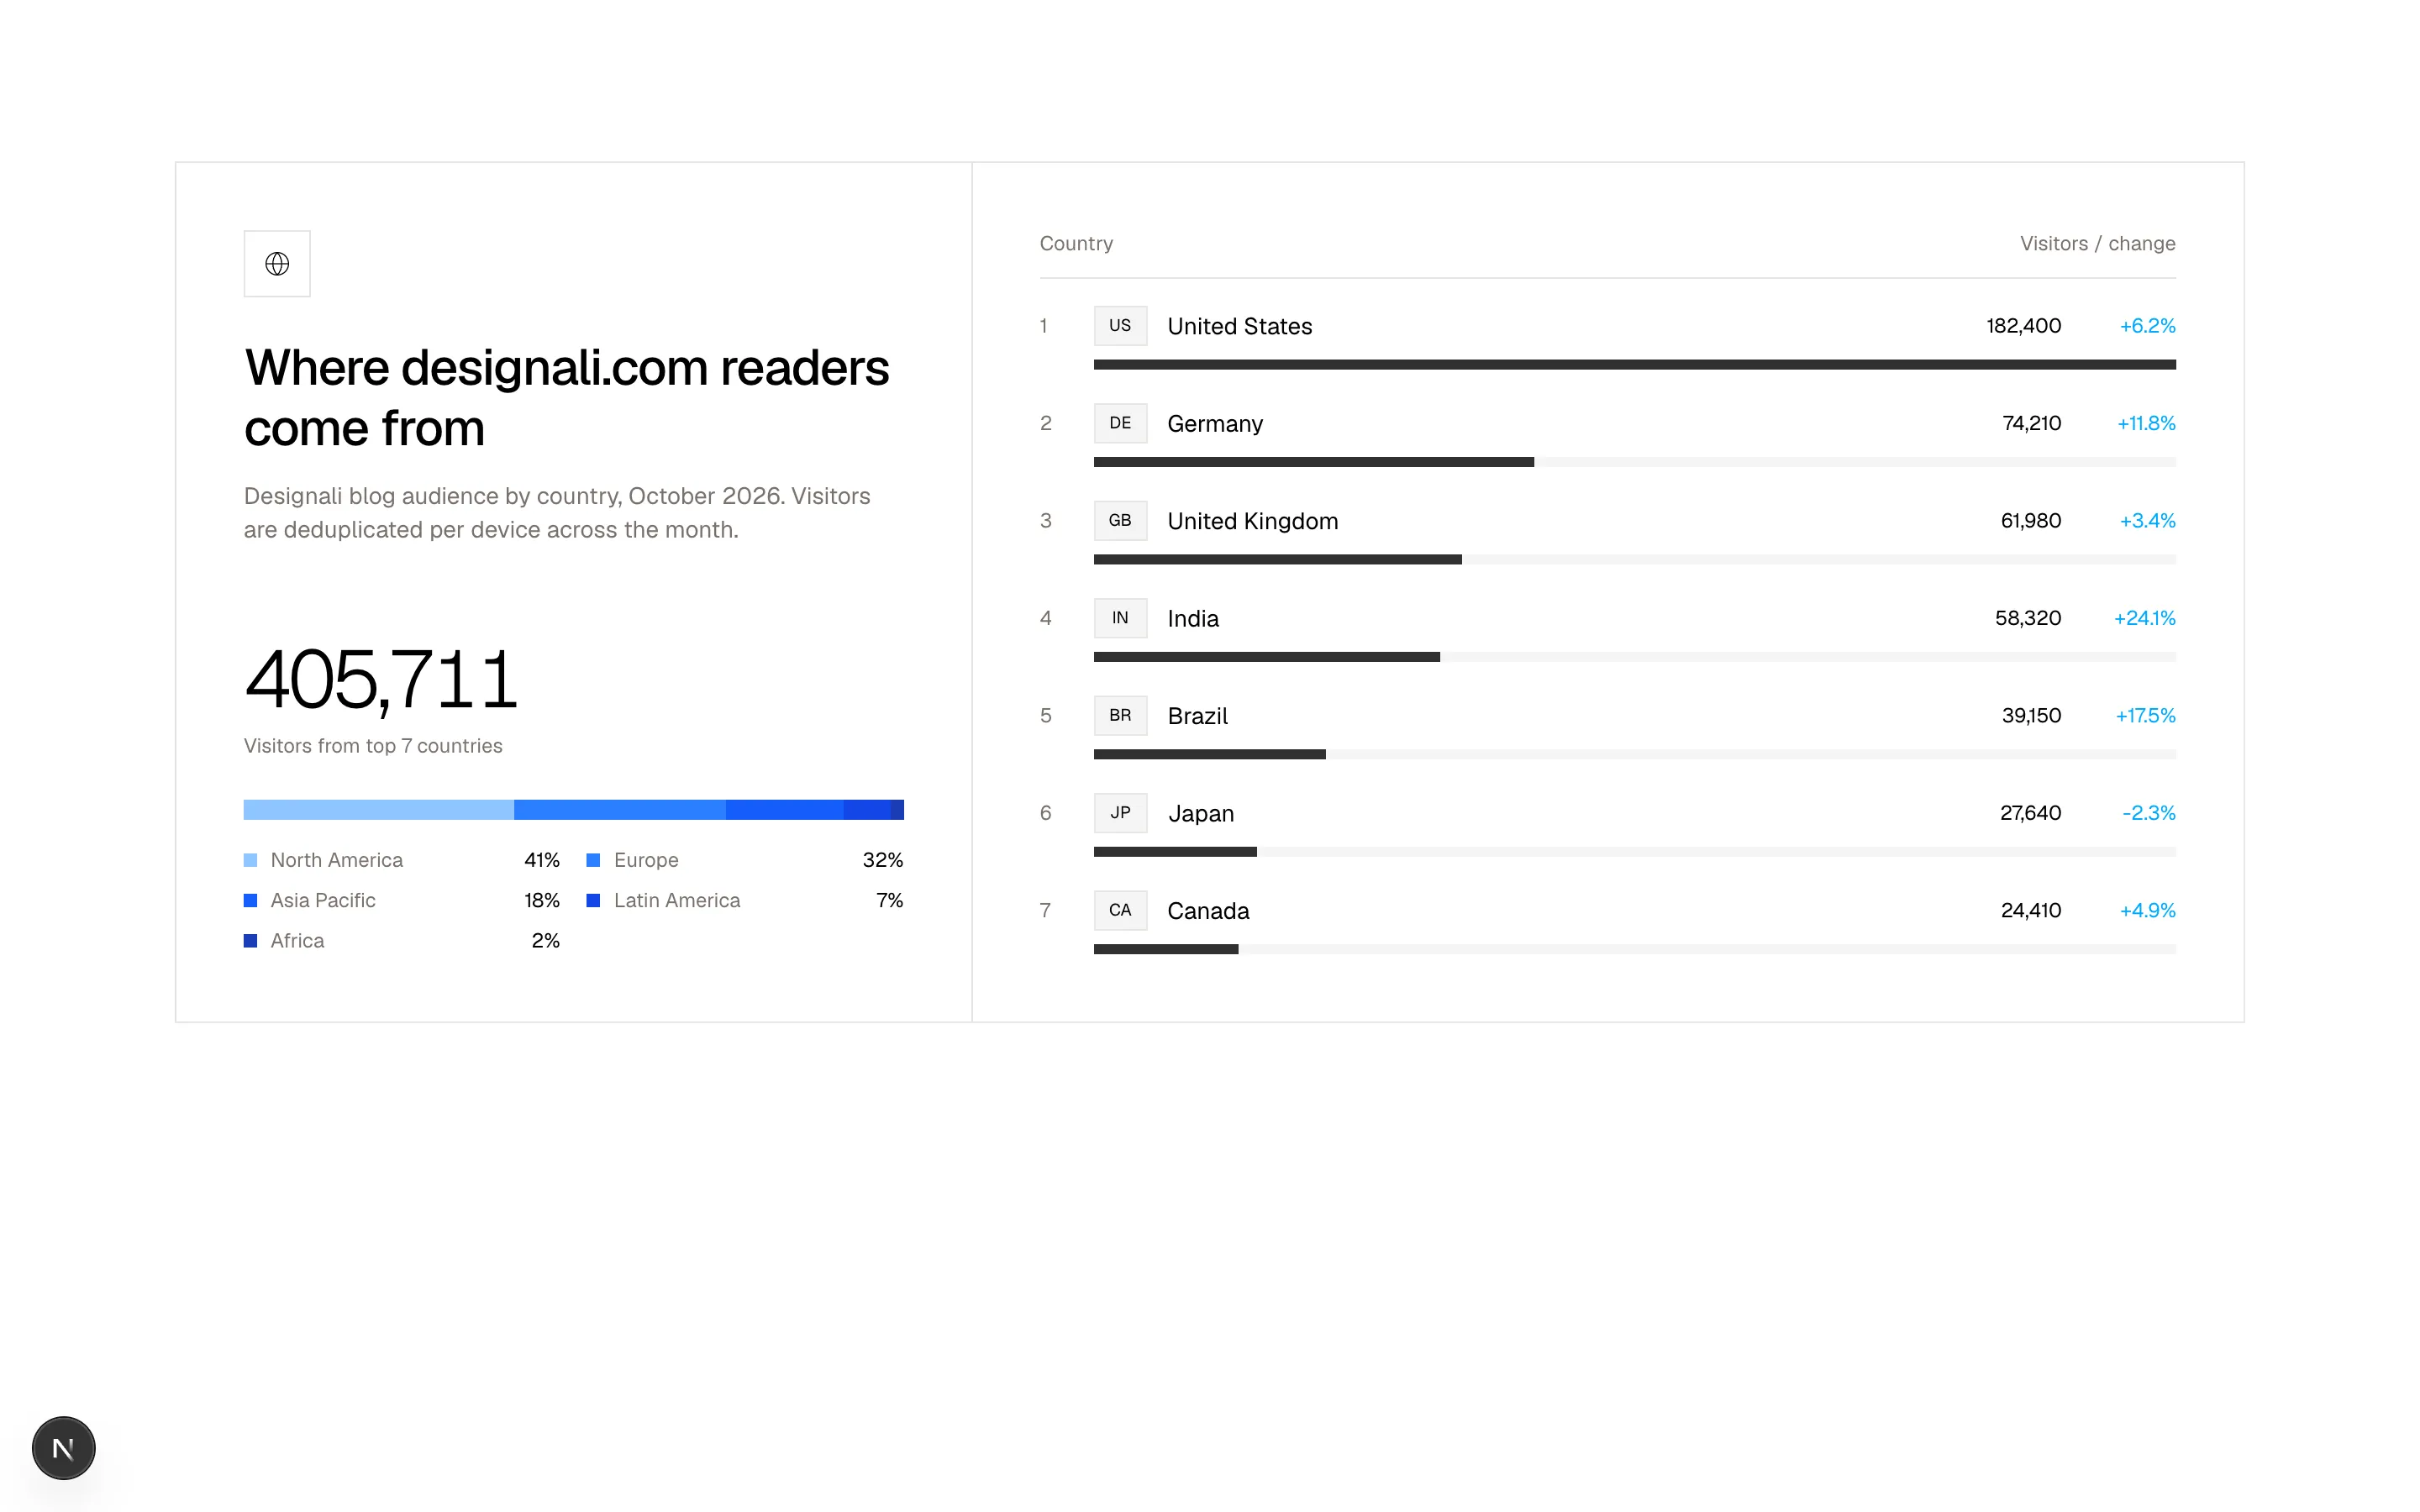
            <h2 className="mt-6 text-3xl font-medium tracking-tight">Where designali.com readers come from</h2>
            <p className="mt-3 text-sm text-muted-foreground">
              Designali blog audience by country, October 2026. Visitors are
              deduplicated per device across the month.
            </p>
          </div>
          <div>
            <CounterNumber value={total} className="block text-5xl font-light tracking-tighter" />
            <p className="mt-2 text-xs text-muted-foreground">Visitors from top 7 countries</p>
            <div className="mt-6 flex h-3 w-full overflow-hidden">
              {continents.map((c, i) => (
                <div
                  key={c.name}
                  style={{ width: `${c.share}%`, background: `var(--chart-${i + 1})` }}
                />
              ))}
            </div>
            <ul className="mt-4 grid grid-cols-2 gap-x-4 gap-y-2 text-xs">
              {continents.map((c, i) => (
                <li key={c.name} className="flex items-center gap-2">
                  <span className="size-2" style={{ background: `var(--chart-${i + 1})` }} />
                  <span className="text-muted-foreground">{c.name}</span>
                  <span className="ml-auto font-sans">{c.share}%</span>
                </li>
              ))}
            </ul>
          </div>
        </div>

        <div className="bg-background p-6 md:p-10">
          <div className="mb-4 grid grid-cols-[1fr_auto] gap-4 border-b pb-3 text-xs text-muted-foreground">
            <span>Country</span>
            <span>Visitors / change</span>
          </div>
          <ol className="space-y-5">
            {regions.map((r, i) => (
              <li key={r.code}>
                <div className="flex items-center gap-3 text-sm">
                  <span className="w-5 font-sans text-xs text-muted-foreground">{i + 1}</span>
                  <span className="flex h-6 w-8 items-center justify-center border bg-muted font-sans text-[10px]">
                    {r.code}
                  </span>
                  <span className="min-w-0 flex-1 truncate">{r.name}</span>
                  <span className="font-sans text-xs">{r.visitors.toLocaleString()}</span>
                  <span
                    className={
                      r.change >= 0
                        ? "w-14 text-right font-sans text-xs text-primary dark:text-primary"
                        : "w-14 text-right font-sans text-xs text-primary dark:text-primary"
                    }
                  >
                    {r.change > 0 ? "+" : ""}
                    {r.change}%
                  </span>
                </div>
                <div className="mt-2 ml-8 h-1.5 bg-muted">
                  <div
                    className="h-full bg-foreground/80"
                    style={{ width: `${(r.visitors / top) * 100}%` }}
                  />
                </div>
              </li>
            ))}
          </ol>
        </div>
        </div>
      </div>
    </section>
  )
}
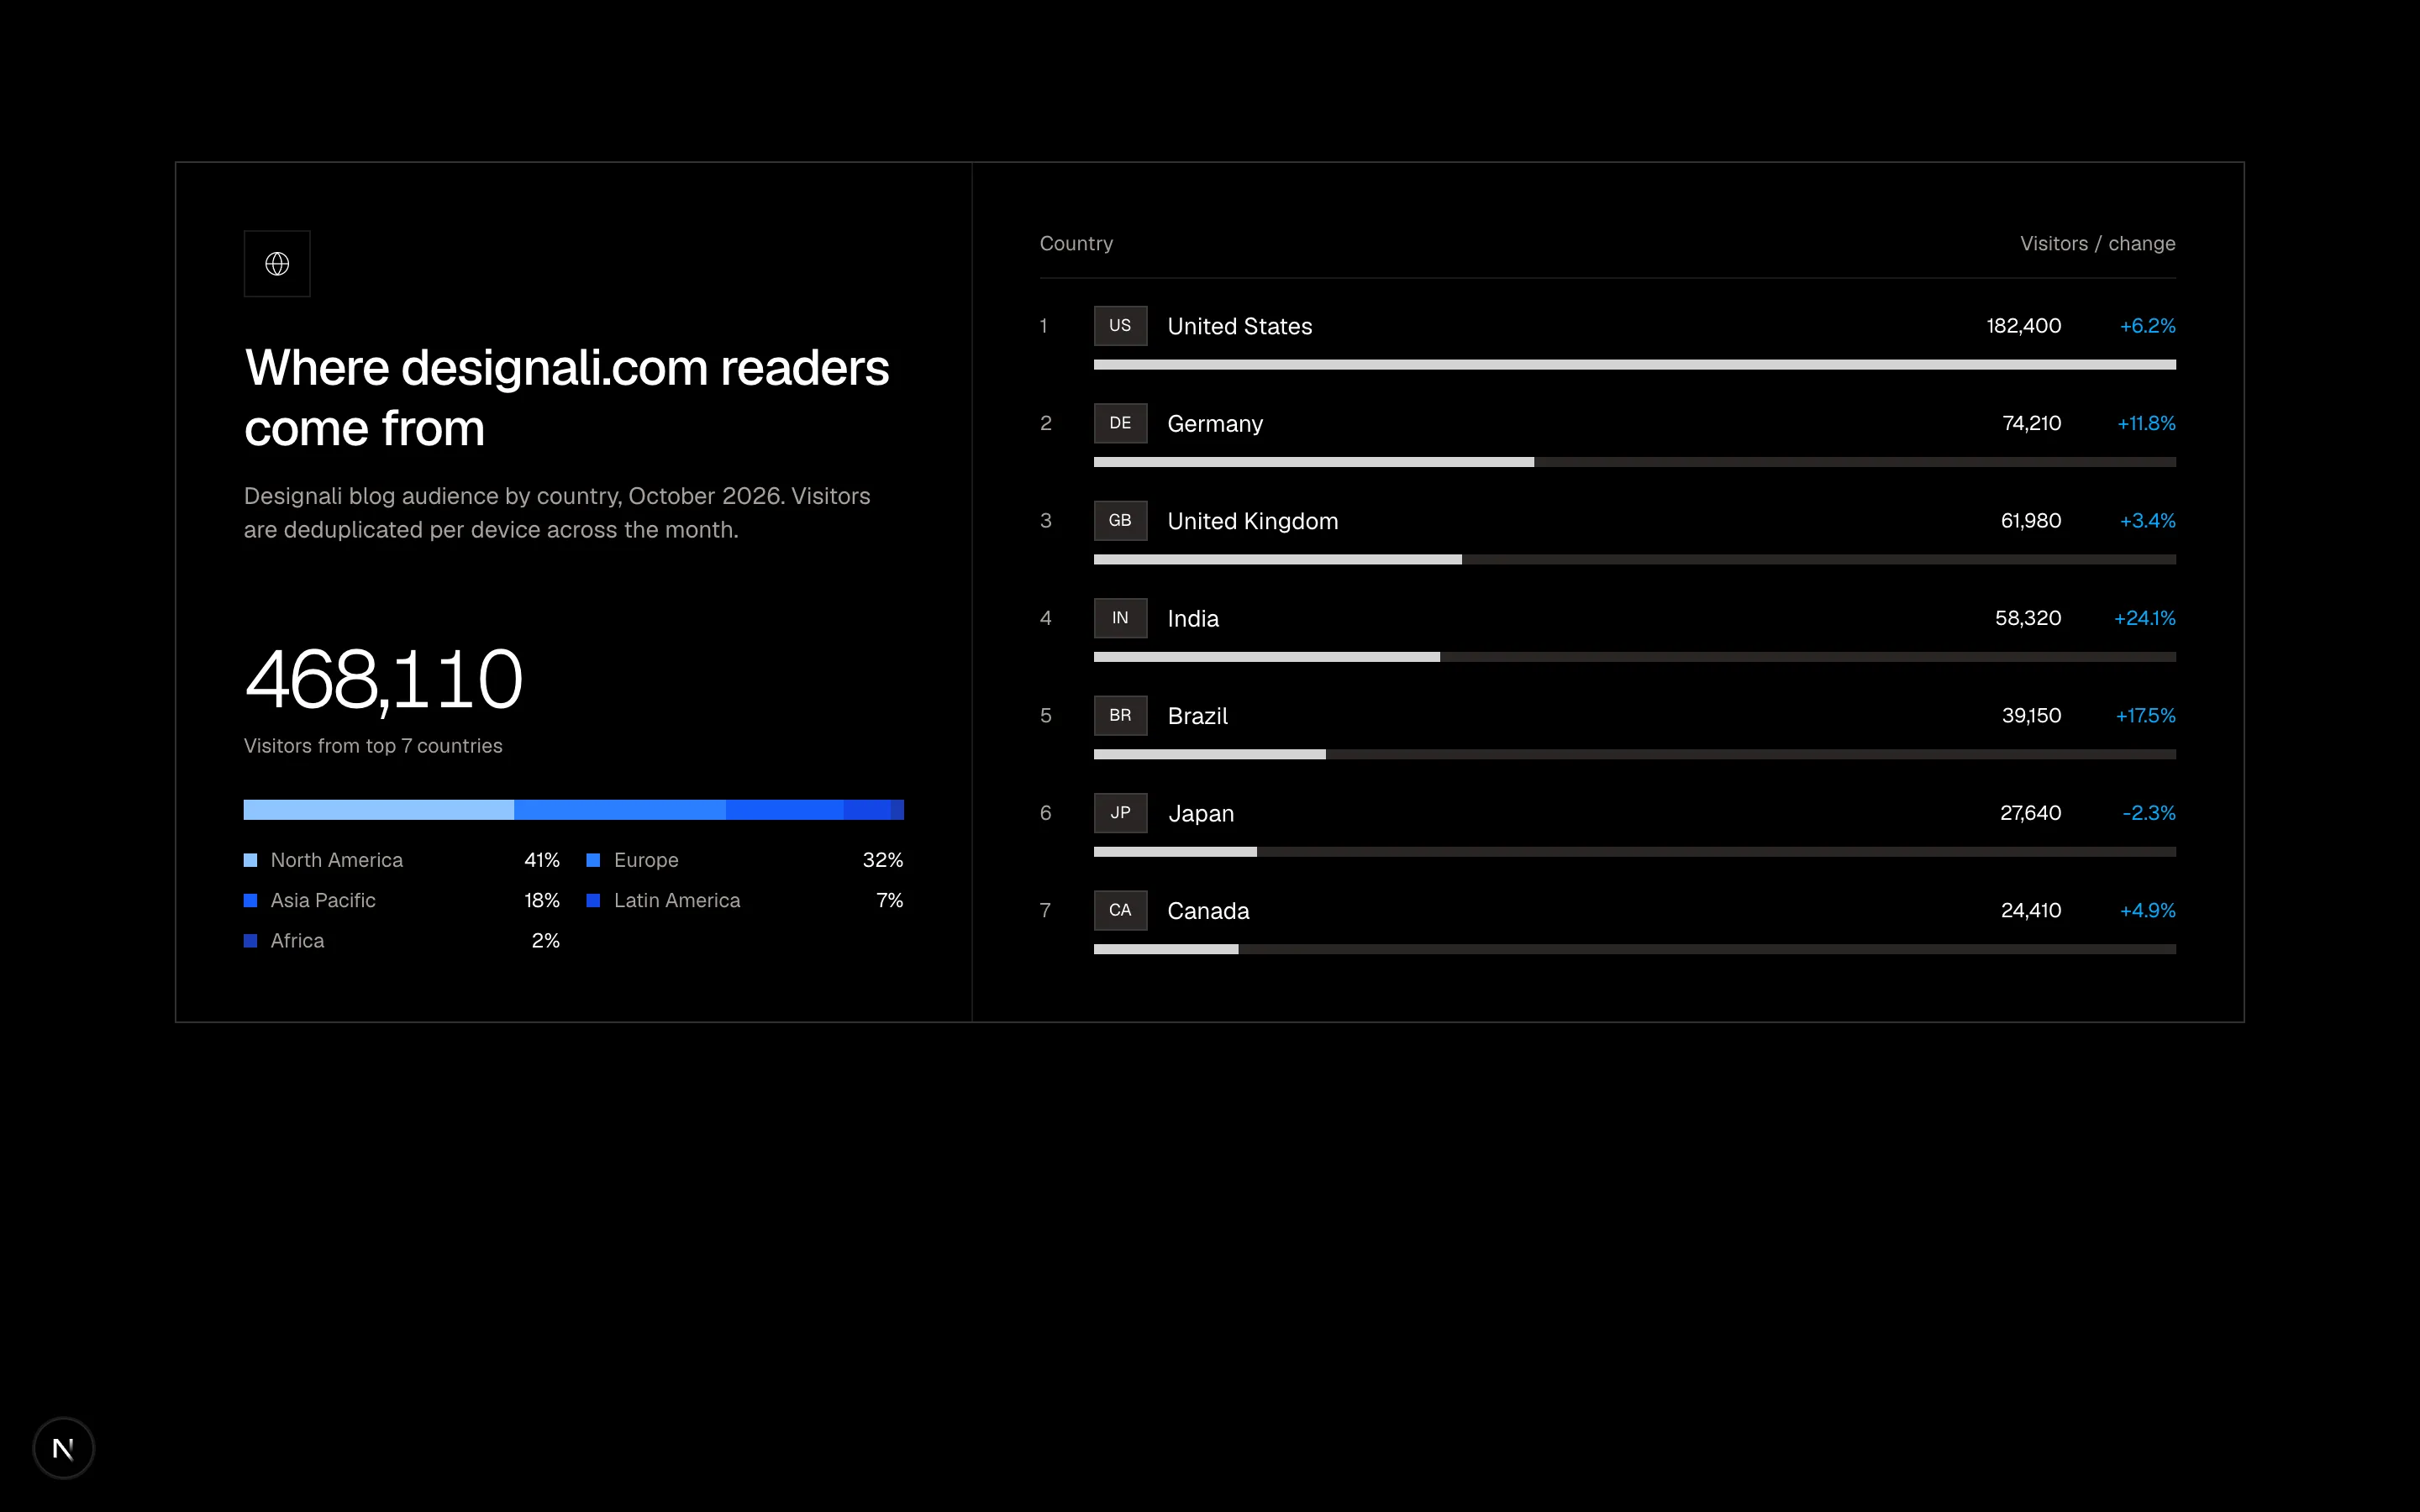
Two-panel geo breakdown with total visitors and continent share bar beside a ranked country list with relative bars.
analytics-10
Files
"use client"

import { useEffect, useState } from "react"

import { CounterNumber } from "@/components/ui/counter-number"

const seed = [38, 42, 40, 45, 51, 48, 53, 57, 55, 60, 58, 62, 66, 63, 61, 67, 70, 68, 72, 69, 74, 71, 76, 79, 77, 81, 78, 83, 86, 84]

const pages = [
  { path: "/icons", live: 412 },
  { path: "/pricing", live: 188 },
  { path: "/docs", live: 141 },
  { path: "/blocks", live: 76 },
]

export function Analytics11() {
  const [series, setSeries] = useState(seed)

  useEffect(() => {
    const id = setInterval(() => {
      setSeries((prev) => {
        const last = prev[prev.length - 1] ?? 60
        const next = Math.max(30, Math.min(100, last + Math.round((Math.random() - 0.45) * 10)))
        return [...prev.slice(1), next]
      })
    }, 1500)
    return () => clearInterval(id)
  }, [])

  const current = series[series.length - 1] ?? 0
  const liveNow = current * 11 + 23
  const max = 100

  return (
    <section className="w-full bg-foreground py-16 text-background md:py-24">
      <div className="mx-auto max-w-7xl px-6">
        <div className="grid gap-12 lg:grid-cols-[1fr_1.3fr] lg:items-end">
          <div>
            <div className="inline-flex items-center gap-2 border border-background/20 px-3 py-1 text-xs">
              <span className="relative flex size-2">
                <span className="absolute inline-flex size-full animate-ping rounded-full bg-primary opacity-75" />
                <span className="relative inline-flex size-2 rounded-full bg-primary" />
              </span>
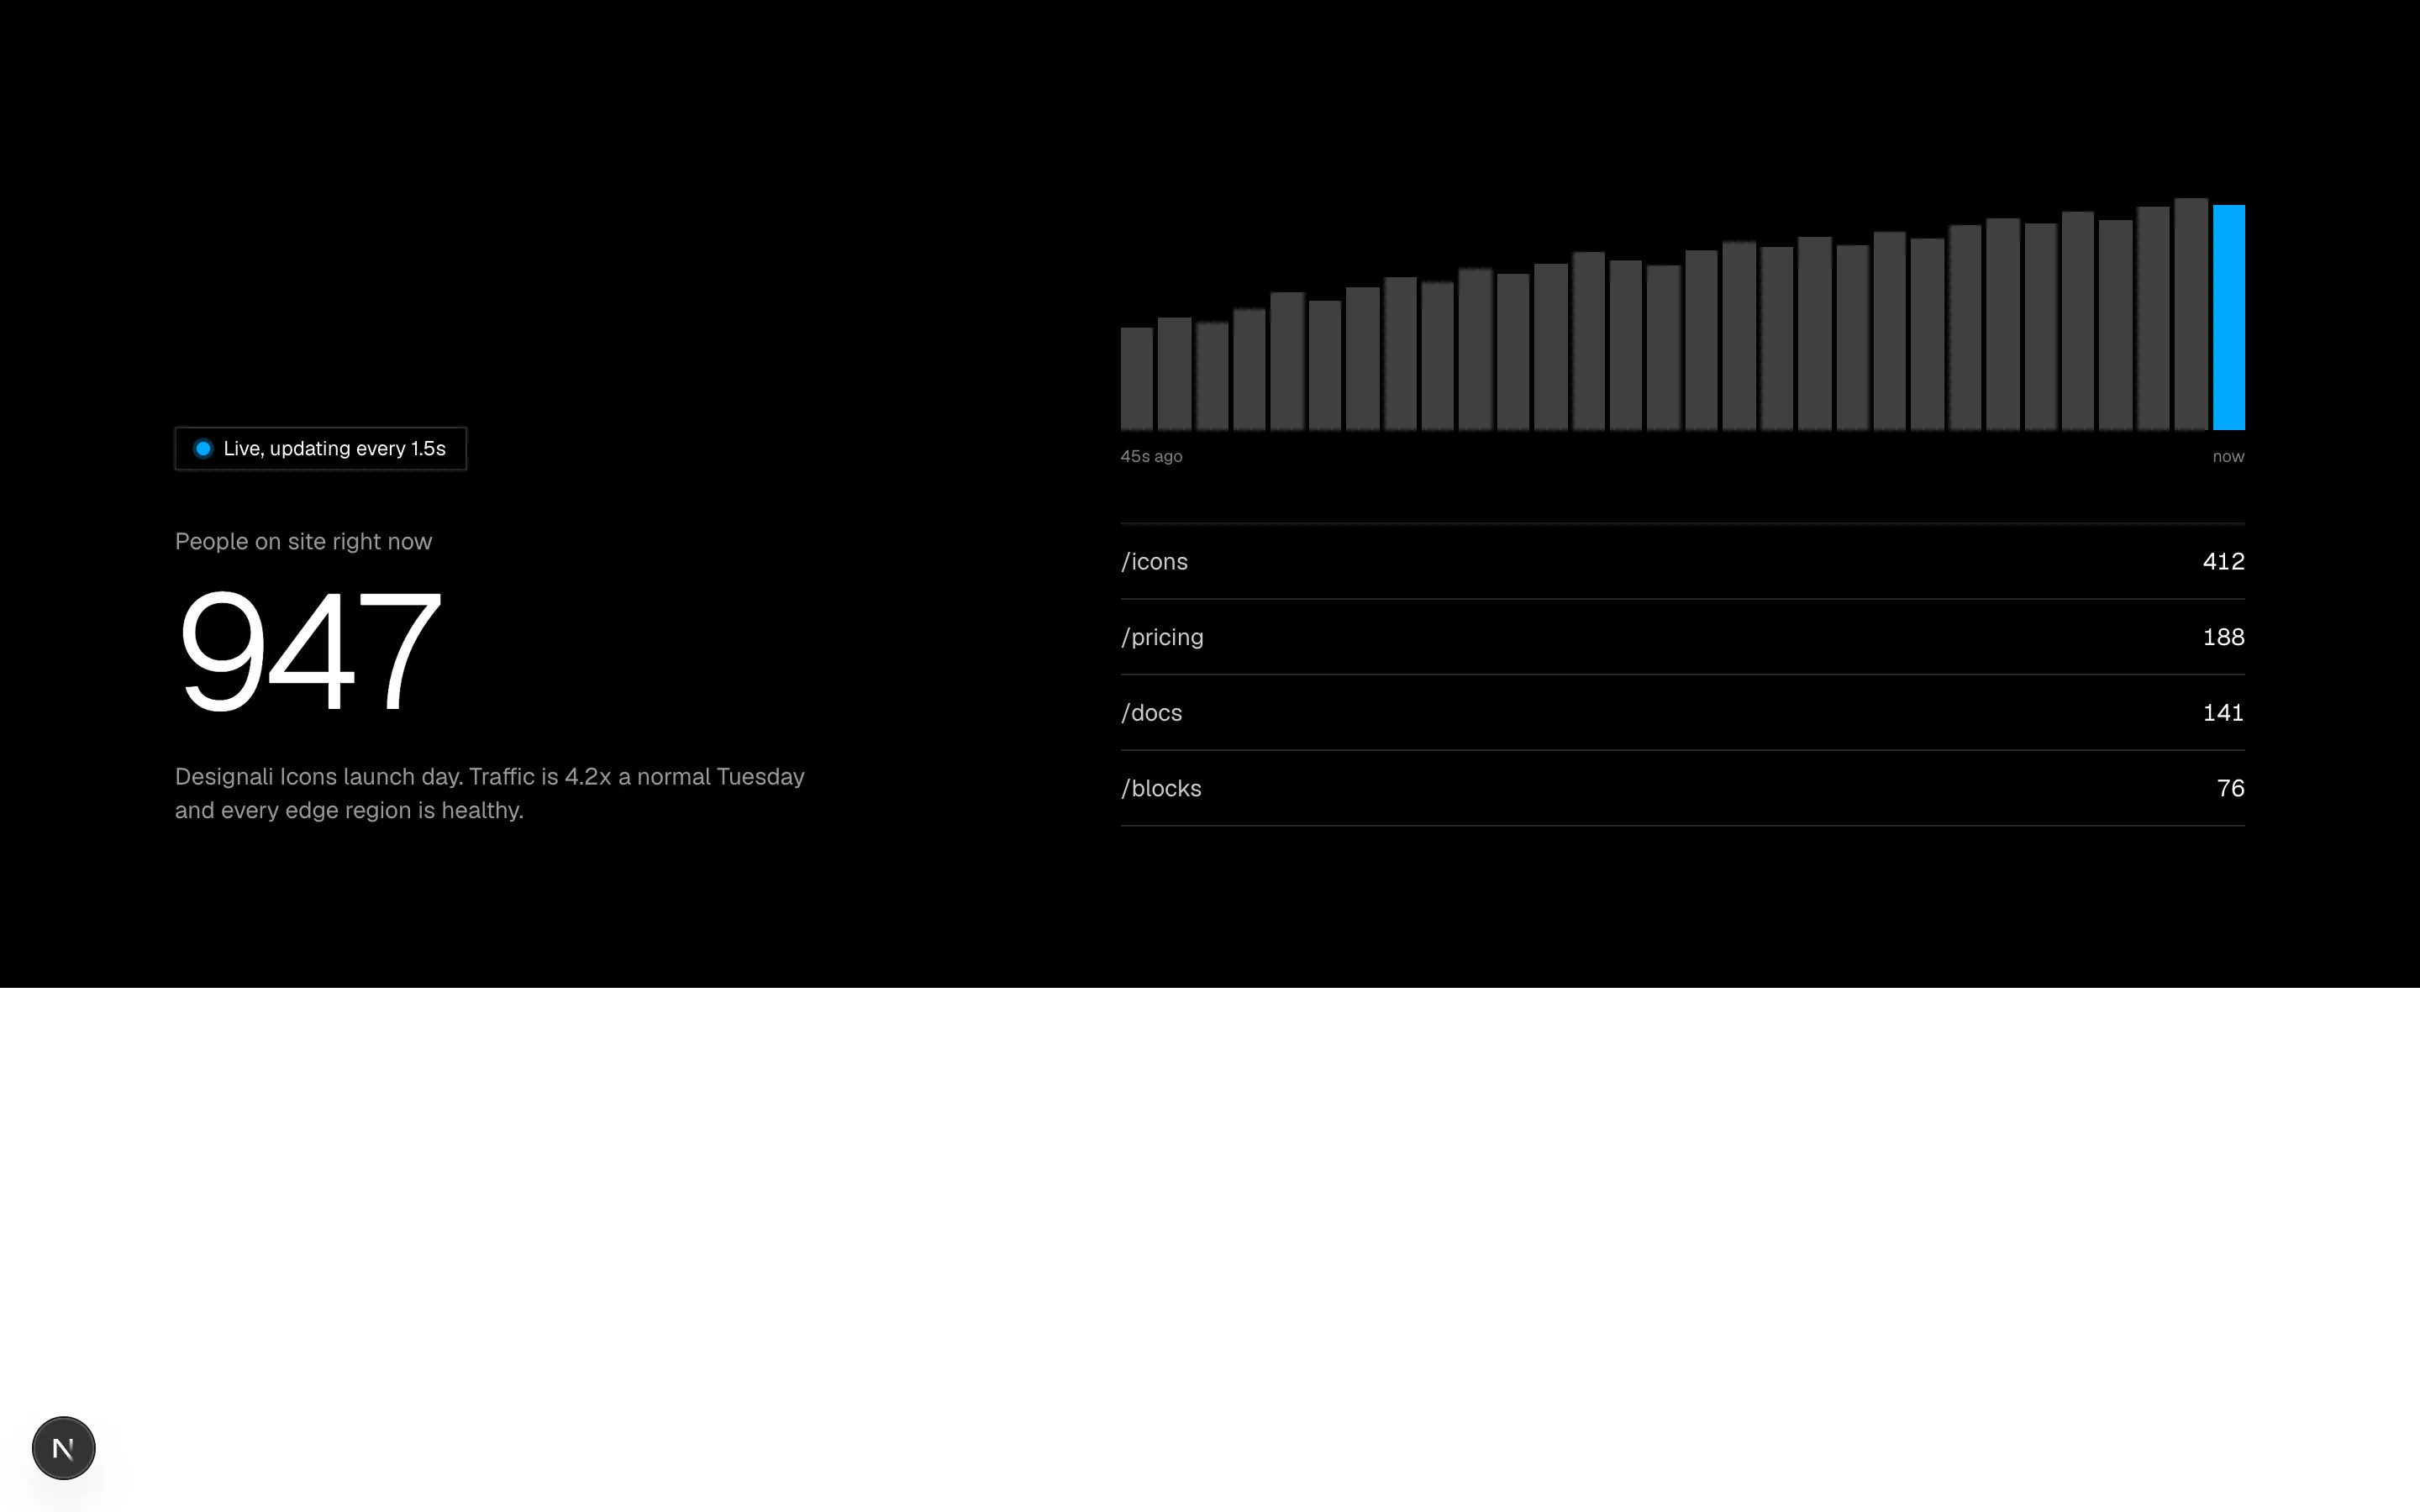
              Live, updating every 1.5s
            </div>
            <p className="mt-8 text-sm text-background/60">People on site right now</p>
            <CounterNumber
              value={liveNow}
              duration={800}
              className="mt-2 block text-6xl font-light tracking-tighter text-background md:text-8xl"
            />
            <p className="mt-4 max-w-sm text-sm text-background/60">
              Designali Icons launch day. Traffic is 4.2x a normal Tuesday and every
              edge region is healthy.
            </p>
          </div>

          <div>
            <div className="flex h-40 items-end gap-[3px]">
              {series.map((v, i) => (
                <div
                  key={i}
                  className="flex-1 bg-background/25 transition-[height] duration-500 last:bg-primary"
                  style={{ height: `${(v / max) * 100}%` }}
                />
              ))}
            </div>
            <div className="mt-2 flex justify-between text-[10px] text-background/50">
              <span>45s ago</span>
              <span>now</span>
            </div>

            <ul className="mt-8 divide-y divide-background/15 border-y border-background/15">
              {pages.map((p) => (
                <li key={p.path} className="flex items-center justify-between gap-4 py-3 text-sm">
                  <span className="min-w-0 truncate font-sans text-background/80">{p.path}</span>
                  <span className="font-sans tabular-nums">{p.live}</span>
                </li>
              ))}
            </ul>
          </div>
        </div>
      </div>
    </section>
  )
}
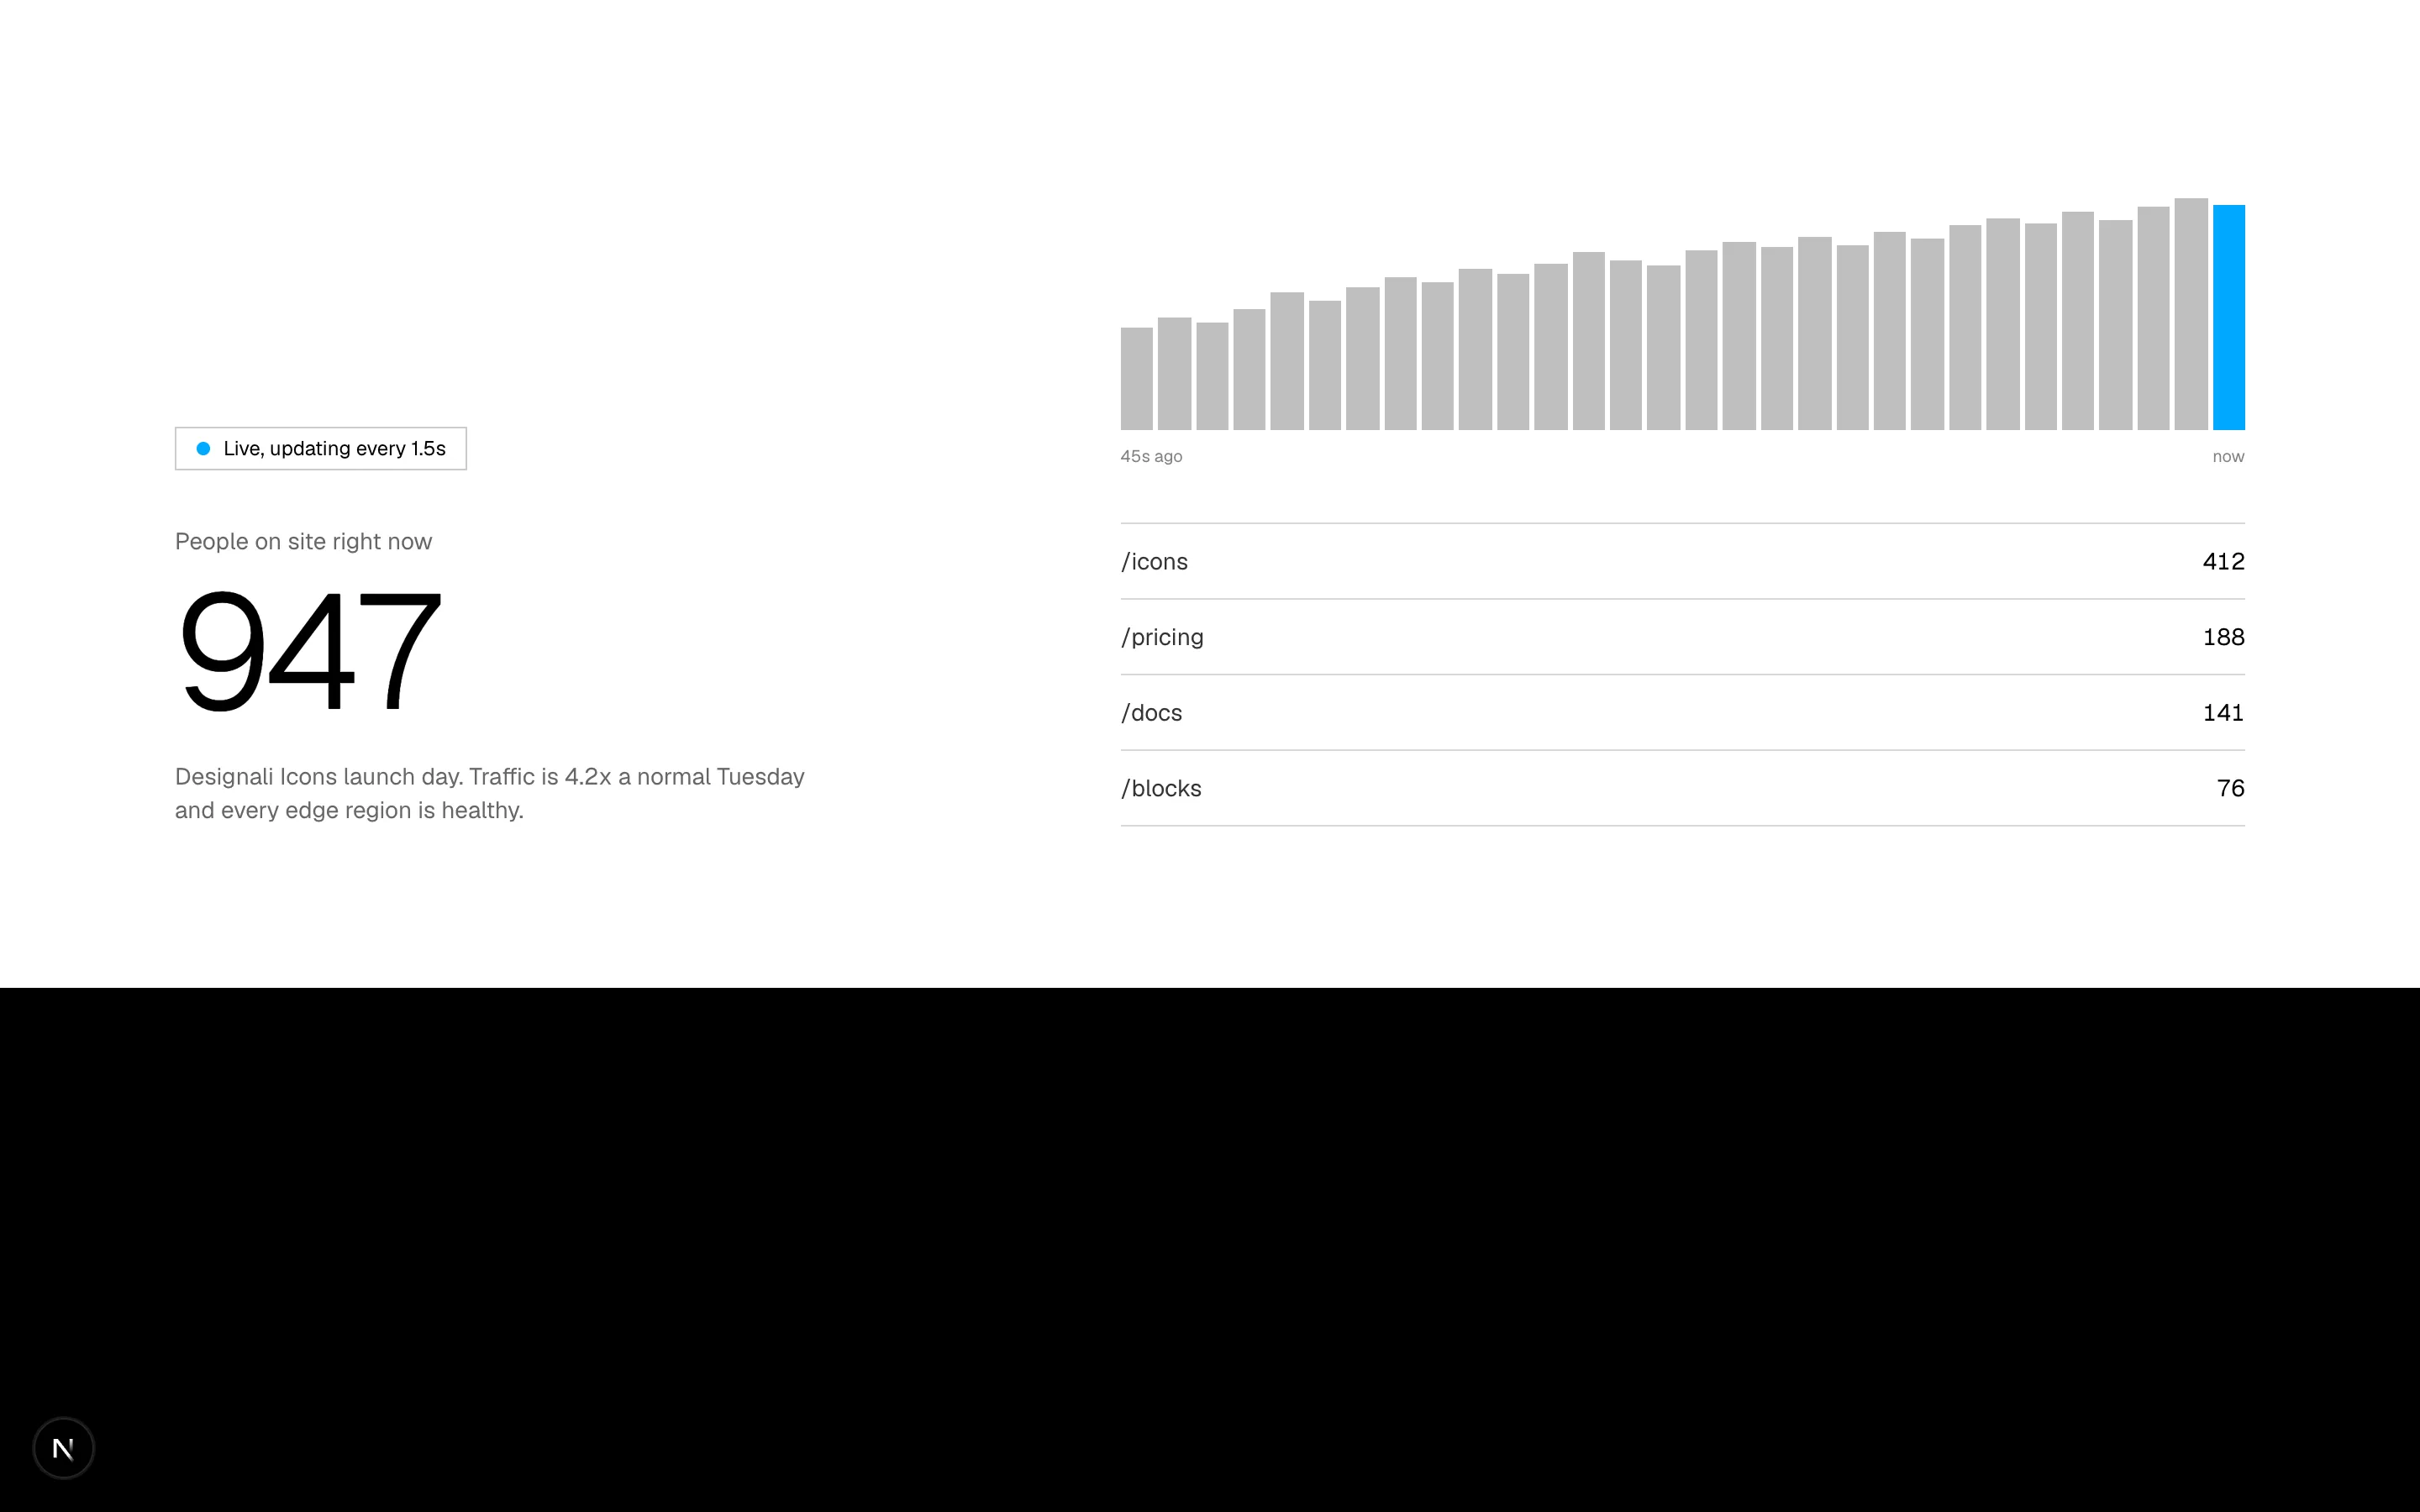
Inverted live band with pulsing status, ticking visitor counter, auto-updating bar stream and top live pages.
analytics-11
Files
"use client"

import { useState } from "react"

import { cn } from "@/lib/utils"

const metrics = [
  {
    key: "mrr",
    label: "MRR",
    value: "$96.4k",
    change: "+9.1%",
    data: [61, 63, 66, 65, 70, 74, 73, 78, 82, 85, 91, 96],
    format: (v: number) => `$${v}k`,
  },
  {
    key: "trials",
    label: "Free blocks copied",
    value: "1,284",
    change: "+15.6%",
    data: [720, 760, 810, 790, 880, 940, 920, 1010, 1080, 1120, 1210, 1284],
    format: (v: number) => v.toLocaleString(),
  },
  {
    key: "activation",
    label: "Activation",
    value: "46%",
    change: "+3.2 pts",
    data: [34, 35, 35, 37, 38, 38, 40, 41, 42, 43, 45, 46],
    format: (v: number) => `${v}%`,
  },
  {
    key: "nps",
    label: "NPS",
    value: "52",
    change: "+4",
    data: [41, 43, 42, 44, 45, 47, 46, 48, 49, 50, 51, 52],
    format: (v: number) => `${v}`,
  },
]

const months = ["Dec", "Jan", "Feb", "Mar", "Apr", "May", "Jun", "Jul", "Aug", "Sep", "Oct", "Nov"]

export function Analytics12() {
  const [activeKey, setActiveKey] = useState("mrr")
  const metric = metrics.find((m) => m.key === activeKey) ?? metrics[0]!
  const max = Math.max(...metric.data)
  const min = Math.min(...metric.data)
  const pad = (max - min) * 0.2
  const coords = metric.data.map((v, i) => ({
    x: (i / (metric.data.length - 1)) * 100,
    y: 95 - ((v - (min - pad)) / (max - min + pad * 2)) * 90,
    v,
  }))
  const line = coords.map((c) => `${c.x},${c.y}`).join(" ")

  return (
    <section className="w-full bg-background py-16 text-foreground md:py-24">
      <div className="mx-auto max-w-7xl px-6">
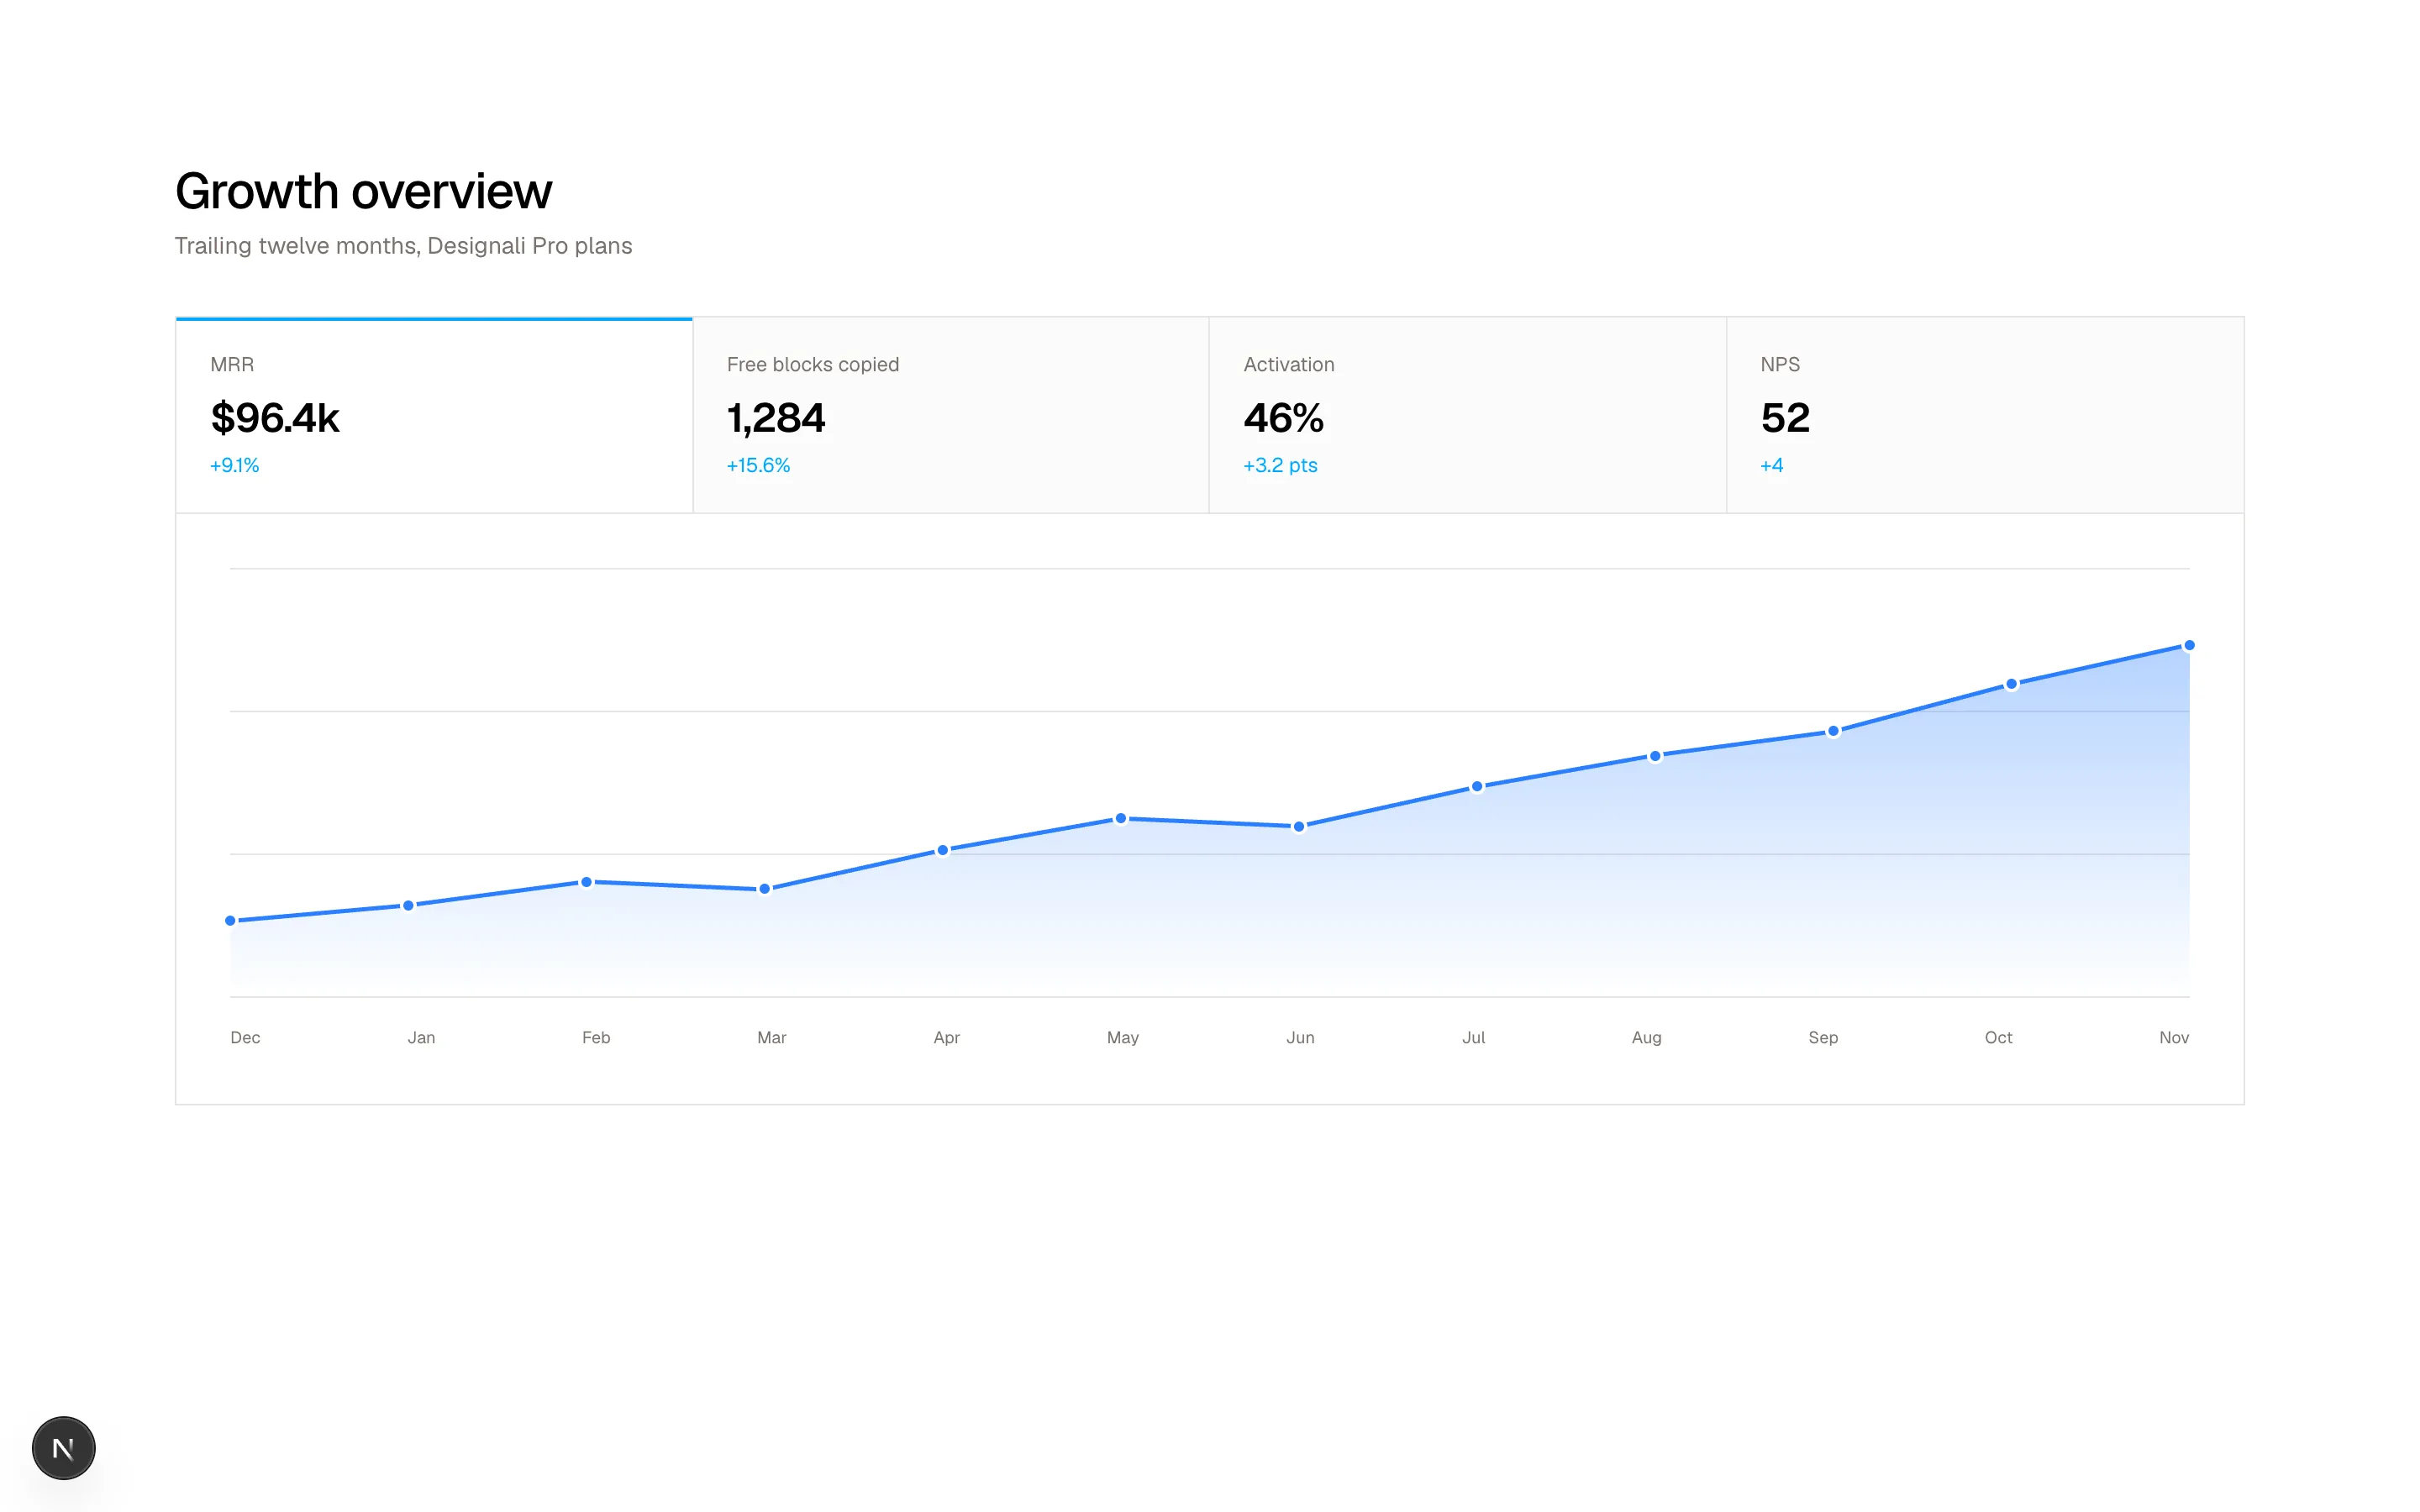
        <h2 className="text-2xl font-medium tracking-tight md:text-3xl">Growth overview</h2>
        <p className="mt-1 text-sm text-muted-foreground">Trailing twelve months, Designali Pro plans</p>

        <div className="mt-8 border">
          <div role="tablist" className="grid grid-cols-2 border-b md:grid-cols-4">
            {metrics.map((m, i) => {
              const on = m.key === activeKey
              return (
                <button
                  key={m.key}
                  role="tab"
                  type="button"
                  aria-selected={on}
                  onClick={() => setActiveKey(m.key)}
                  className={cn(
                    "relative p-5 text-left transition-colors",
                    i % 2 === 0 && "border-r",
                    i < 2 && "border-b md:border-b-0",
                    i === 1 && "md:border-r",
                    on ? "bg-background" : "bg-muted/40 hover:bg-muted/70"
                  )}
                >
                  {on && <span className="absolute inset-x-0 top-0 h-0.5 bg-primary" />}
                  <p className="text-xs text-muted-foreground">{m.label}</p>
                  <p className="mt-2 text-2xl font-semibold tracking-tight">{m.value}</p>
                  <p className="mt-1 text-xs text-primary dark:text-primary">{m.change}</p>
                </button>
              )
            })}
          </div>

          <div className="p-6 md:p-8">
            <div className="relative h-64">
              <div className="absolute inset-0 flex flex-col justify-between">
                {[0, 1, 2, 3].map((i) => (
                  <div key={i} className="border-t border-border" />
                ))}
              </div>
              <svg
                viewBox="0 0 100 100"
                preserveAspectRatio="none"
                className="absolute inset-0 h-full w-full overflow-visible"
              >
                <defs>
                  <linearGradient id="analytics12-fill" x1="0" x2="0" y1="0" y2="1">
                    <stop offset="0%" stopColor="var(--chart-2)" stopOpacity="0.35" />
                    <stop offset="100%" stopColor="var(--chart-2)" stopOpacity="0" />
                  </linearGradient>
                </defs>
                <polygon points={`0,100 ${line} 100,100`} fill="url(#analytics12-fill)" />
                <polyline
                  points={line}
                  fill="none"
                  stroke="var(--chart-2)"
                  strokeWidth="2.5"
                  vectorEffect="non-scaling-stroke"
                  strokeLinejoin="round"
                />
              </svg>
              {coords.map((c, i) => (
                <div
                  key={i}
                  className="group absolute -translate-x-1/2 -translate-y-1/2"
                  style={{ left: `${c.x}%`, top: `${c.y}%` }}
                >
                  <span className="block size-2.5 rounded-full border-2 border-background bg-chart-2" />
                  <span className="pointer-events-none absolute bottom-4 left-1/2 hidden -translate-x-1/2 border bg-popover px-2 py-1 text-xs whitespace-nowrap text-popover-foreground shadow-sm group-hover:block">
                    {months[i]}: {metric.format(c.v)}
                  </span>
                </div>
              ))}
            </div>
            <div className="mt-4 flex justify-between text-[10px] text-muted-foreground">
              {months.map((m, i) => (
                <span key={m} className={cn(i % 2 === 1 && "hidden sm:inline")}>
                  {m}
                </span>
              ))}
            </div>
          </div>
        </div>
      </div>
    </section>
  )
}
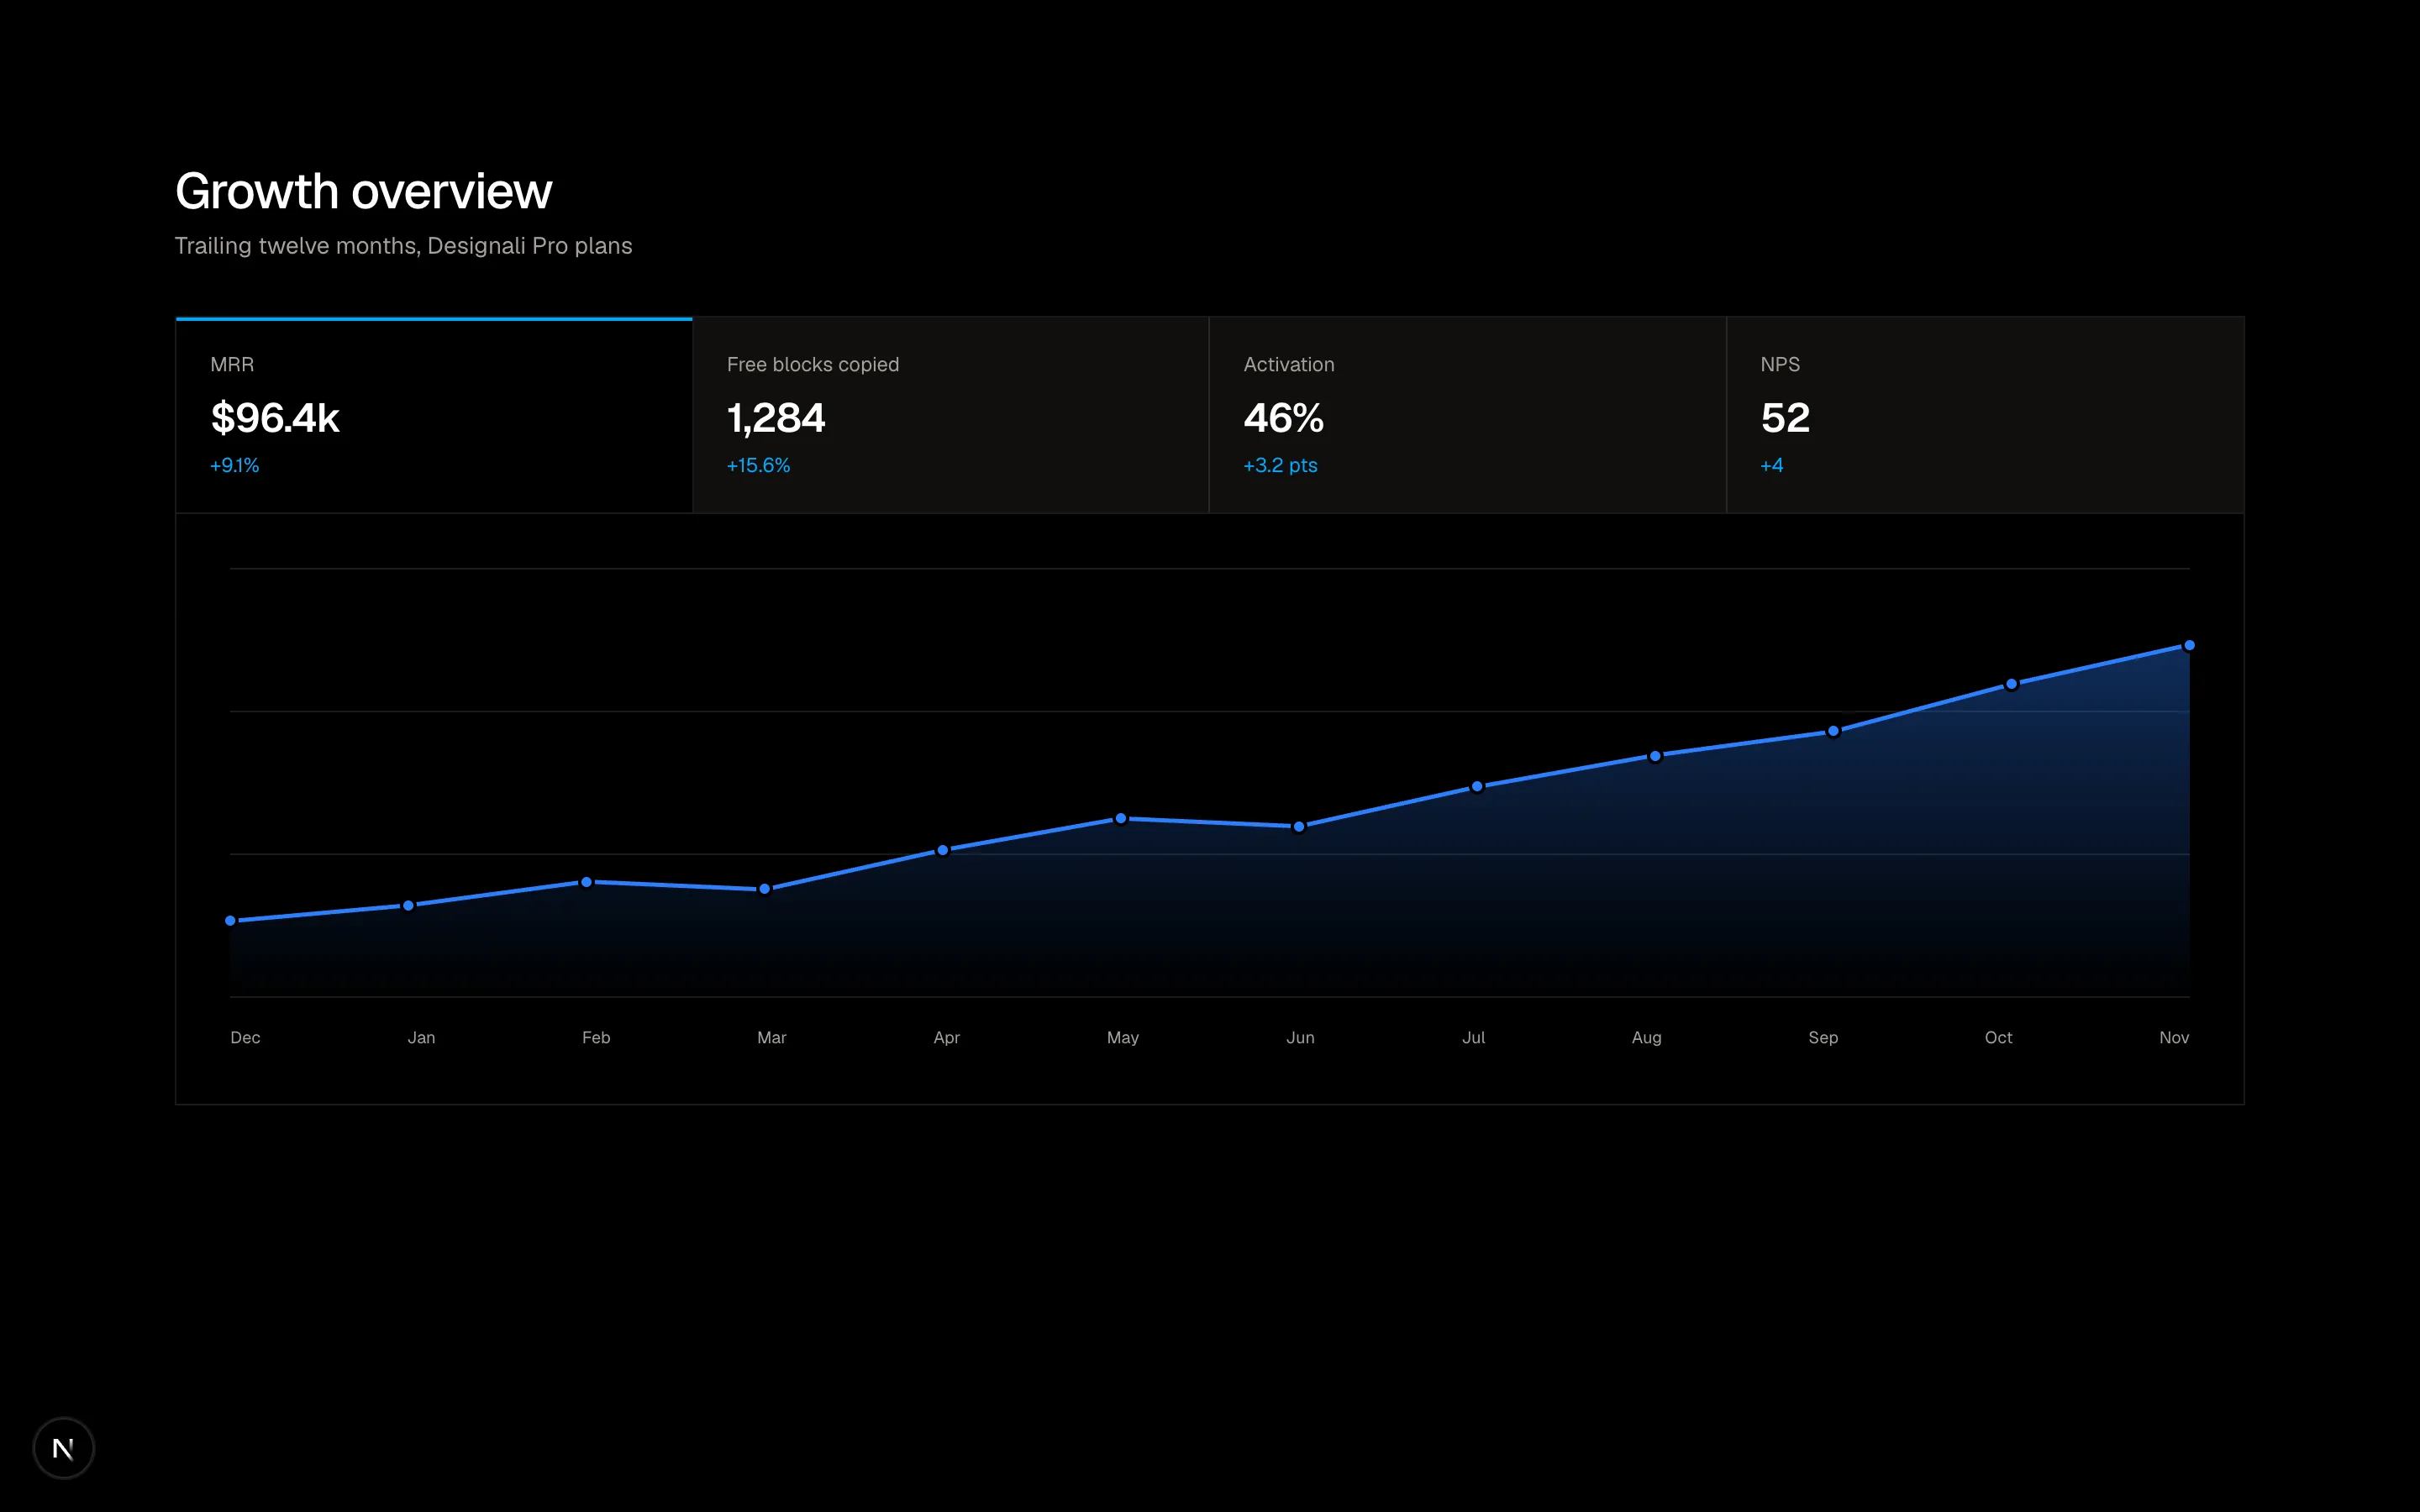
KPI tab strip that switches a gradient area chart with hover point tooltips across twelve months.
analytics-12
Files
import { CounterNumber } from "@/components/ui/counter-number"

const days = Array.from({ length: 30 }, (_, i) => i + 1)
const current = [212, 240, 228, 265, 290, 180, 172, 254, 281, 276, 302, 318, 205, 198, 296, 322, 314, 340, 352, 231, 219, 335, 361, 348, 377, 389, 260, 248, 372, 401]
const previous = [190, 205, 214, 230, 241, 160, 151, 222, 238, 236, 251, 262, 178, 169, 248, 259, 266, 271, 280, 190, 182, 270, 284, 279, 291, 298, 205, 199, 286, 302]

function toPoints(data: number[], max: number) {
  return data
    .map((v, i) => `${(i / (data.length - 1)) * 100},${100 - (v / max) * 100}`)
    .join(" ")
}

export function Analytics13() {
  const max = Math.max(...current, ...previous) * 1.1
  const sumCur = current.reduce((s, v) => s + v, 0)
  const sumPrev = previous.reduce((s, v) => s + v, 0)
  const lift = ((sumCur - sumPrev) / sumPrev) * 100
  const ticks = [0, 0.25, 0.5, 0.75, 1].map((t) => Math.round(max * (1 - t)))

  return (
    <section className="w-full bg-background py-16 text-foreground md:py-24">
      <div className="mx-auto max-w-7xl px-6">
        <div className="grid gap-8 lg:grid-cols-[2.2fr_1fr]">
          <div className="border p-6 md:p-8">
            <div className="flex flex-wrap items-center justify-between gap-4">
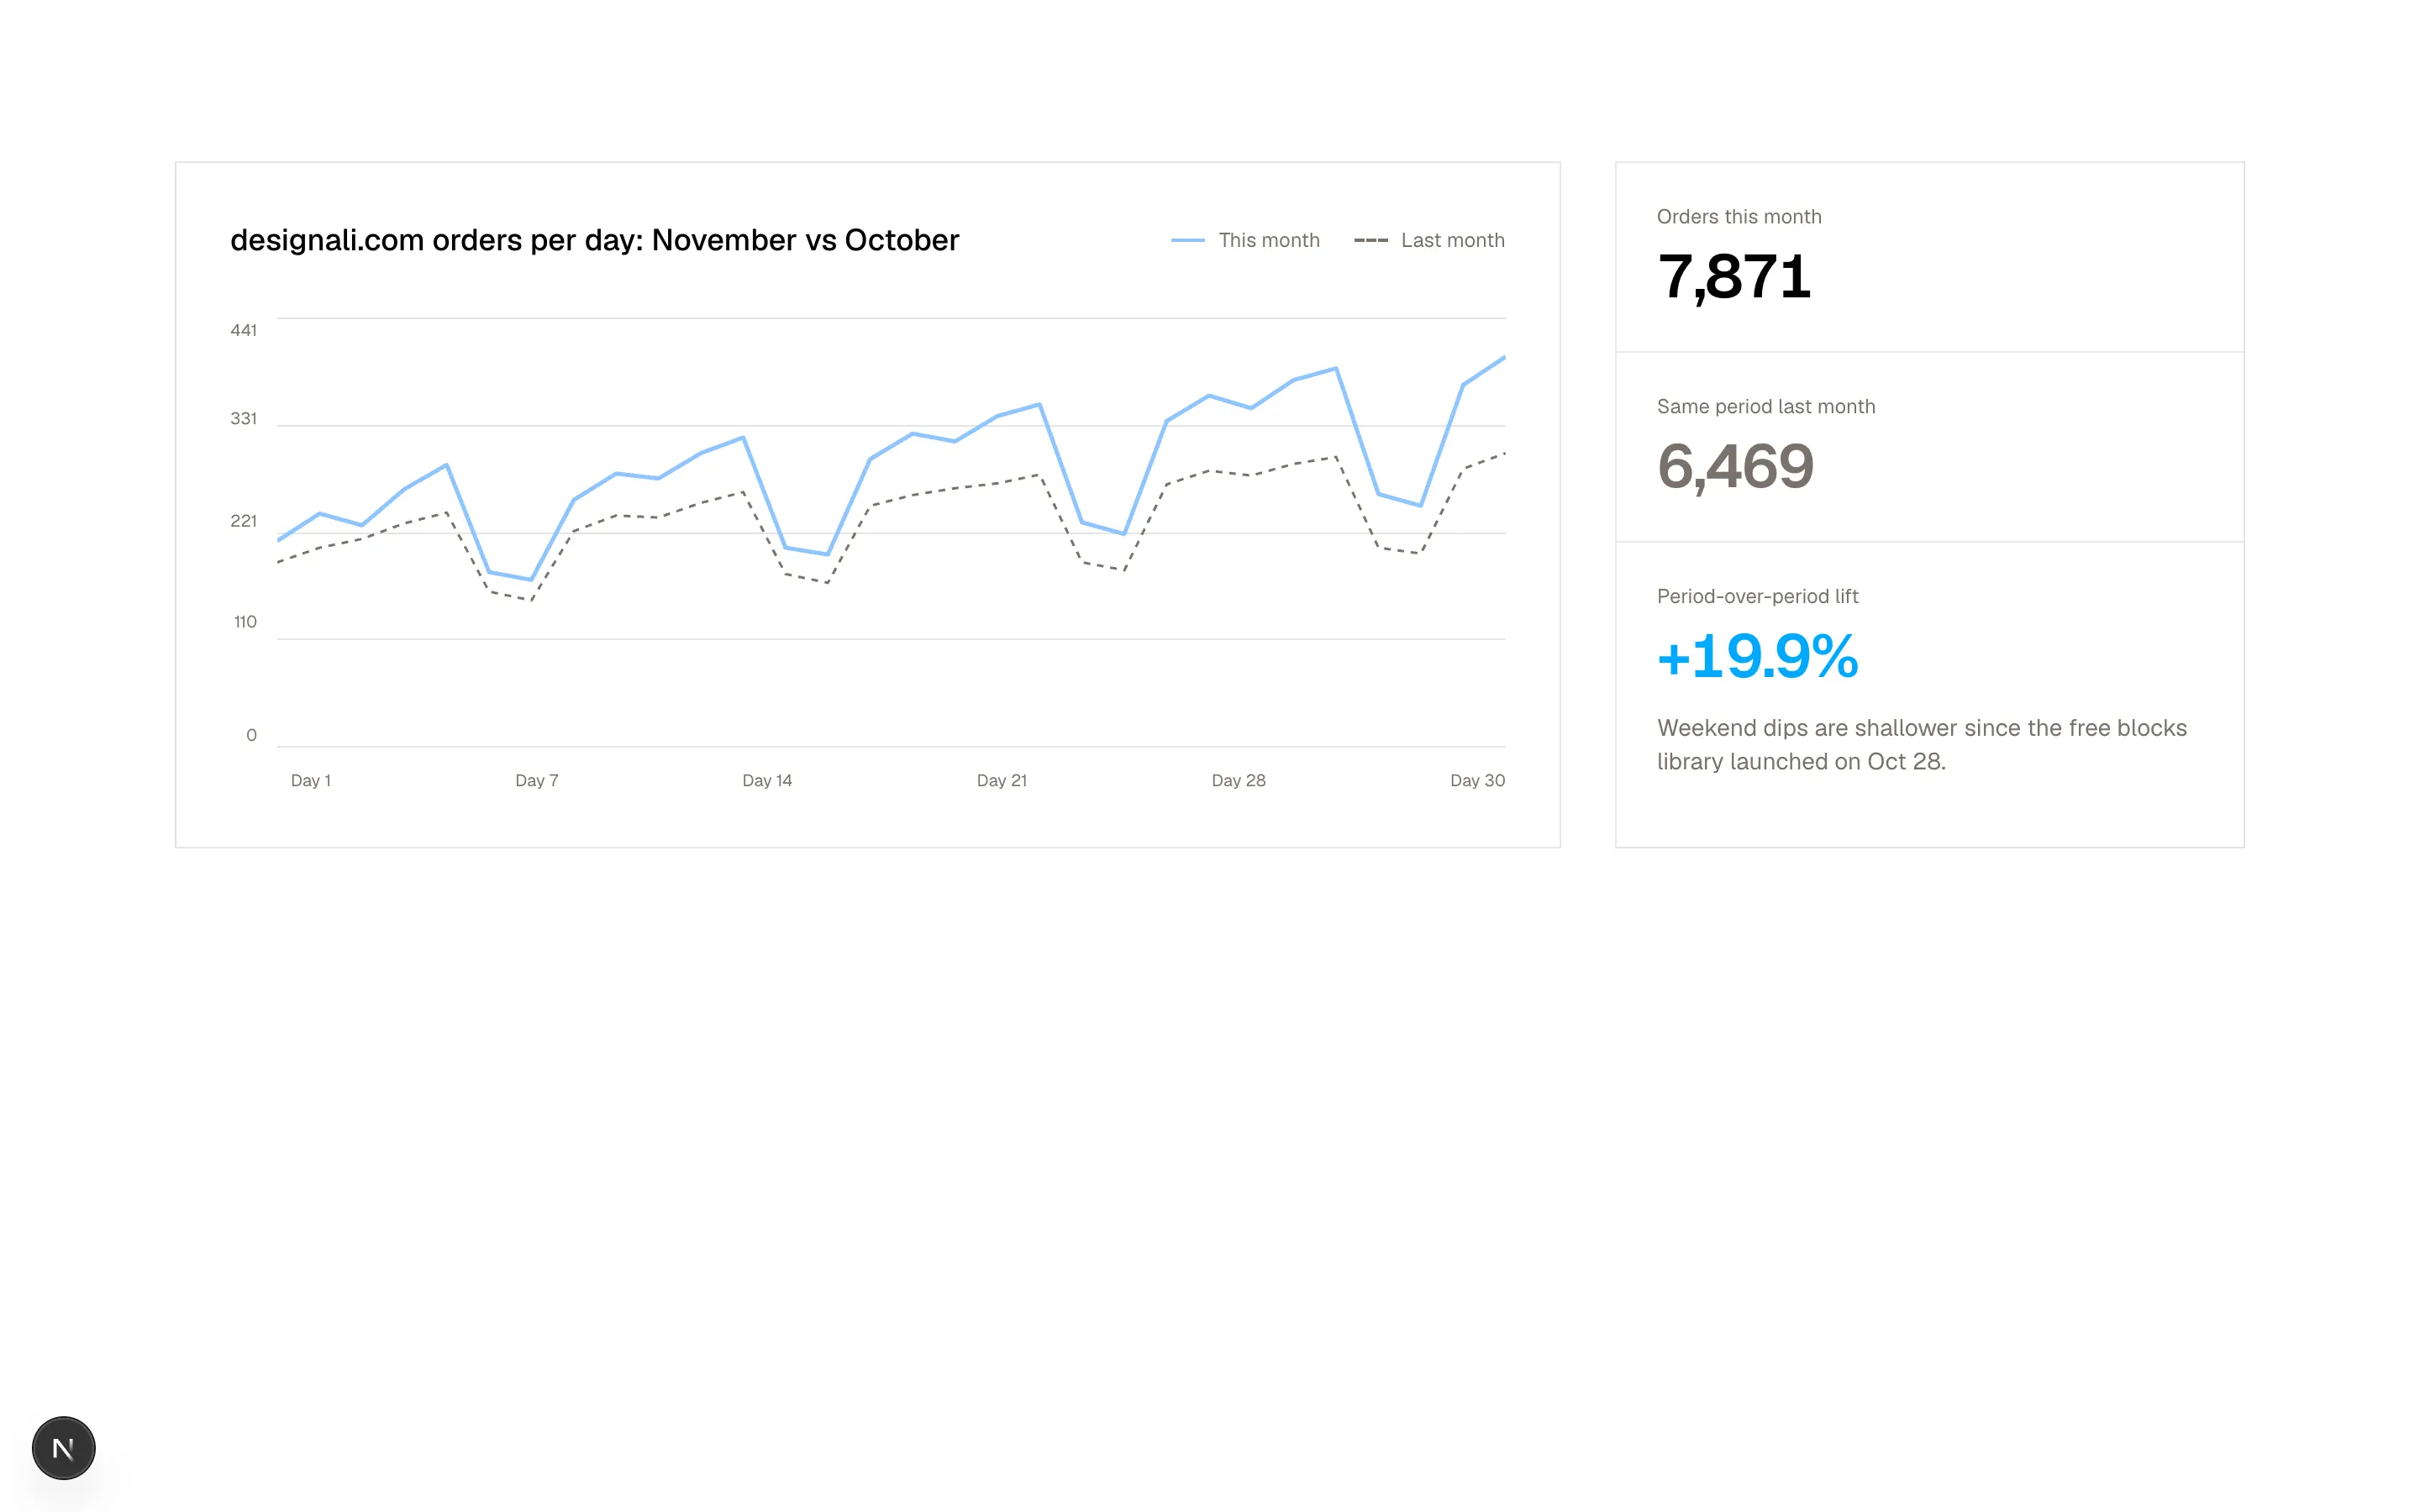
              <h2 className="text-lg font-medium">designali.com orders per day: November vs October</h2>
              <div className="flex items-center gap-5 text-xs text-muted-foreground">
                <span className="flex items-center gap-2">
                  <span className="h-0.5 w-5 bg-chart-1" />
                  This month
                </span>
                <span className="flex items-center gap-2">
                  <span className="w-5 border-t-2 border-dashed border-muted-foreground" />
                  Last month
                </span>
              </div>
            </div>

            <div className="mt-8 flex gap-3">
              <div className="flex h-64 flex-col justify-between text-right font-sans text-[10px] text-muted-foreground">
                {ticks.map((t) => (
                  <span key={t} className="-translate-y-1/2 first:translate-y-0 last:translate-y-0">
                    {t}
                  </span>
                ))}
              </div>
              <div className="relative h-64 flex-1">
                <div className="absolute inset-0 flex flex-col justify-between">
                  {ticks.map((t) => (
                    <div key={t} className="border-t border-border" />
                  ))}
                </div>
                <svg
                  viewBox="0 0 100 100"
                  preserveAspectRatio="none"
                  className="absolute inset-0 h-full w-full"
                >
                  <polyline
                    points={toPoints(previous, max)}
                    fill="none"
                    stroke="var(--muted-foreground)"
                    strokeWidth="1.5"
                    strokeDasharray="4 4"
                    vectorEffect="non-scaling-stroke"
                  />
                  <polyline
                    points={toPoints(current, max)}
                    fill="none"
                    stroke="var(--chart-1)"
                    strokeWidth="2.5"
                    vectorEffect="non-scaling-stroke"
                    strokeLinejoin="round"
                  />
                </svg>
              </div>
            </div>
            <div className="mt-3 ml-9 flex justify-between font-sans text-[10px] text-muted-foreground">
              {days
                .filter((d) => d === 1 || d % 7 === 0 || d === 30)
                .map((d) => (
                  <span key={d}>Day {d}</span>
                ))}
            </div>
          </div>

          <div className="flex flex-col gap-px border bg-border">
            <div className="bg-background p-6">
              <p className="text-xs text-muted-foreground">Orders this month</p>
              <CounterNumber value={sumCur} className="mt-2 block text-4xl font-semibold tracking-tight" />
            </div>
            <div className="bg-background p-6">
              <p className="text-xs text-muted-foreground">Same period last month</p>
              <CounterNumber
                value={sumPrev}
                color="secondary"
                className="mt-2 block text-4xl font-semibold tracking-tight"
              />
            </div>
            <div className="flex-1 bg-background p-6">
              <p className="text-xs text-muted-foreground">Period-over-period lift</p>
              <CounterNumber
                value={lift}
                prefix="+"
                suffix="%"
                decimalPlaces={1}
                color="primary"
                className="mt-2 block text-4xl font-semibold tracking-tight"
              />
              <p className="mt-3 text-sm text-muted-foreground">
                Weekend dips are shallower since the free blocks library launched on Oct 28.
              </p>
            </div>
          </div>
        </div>
      </div>
    </section>
  )
}
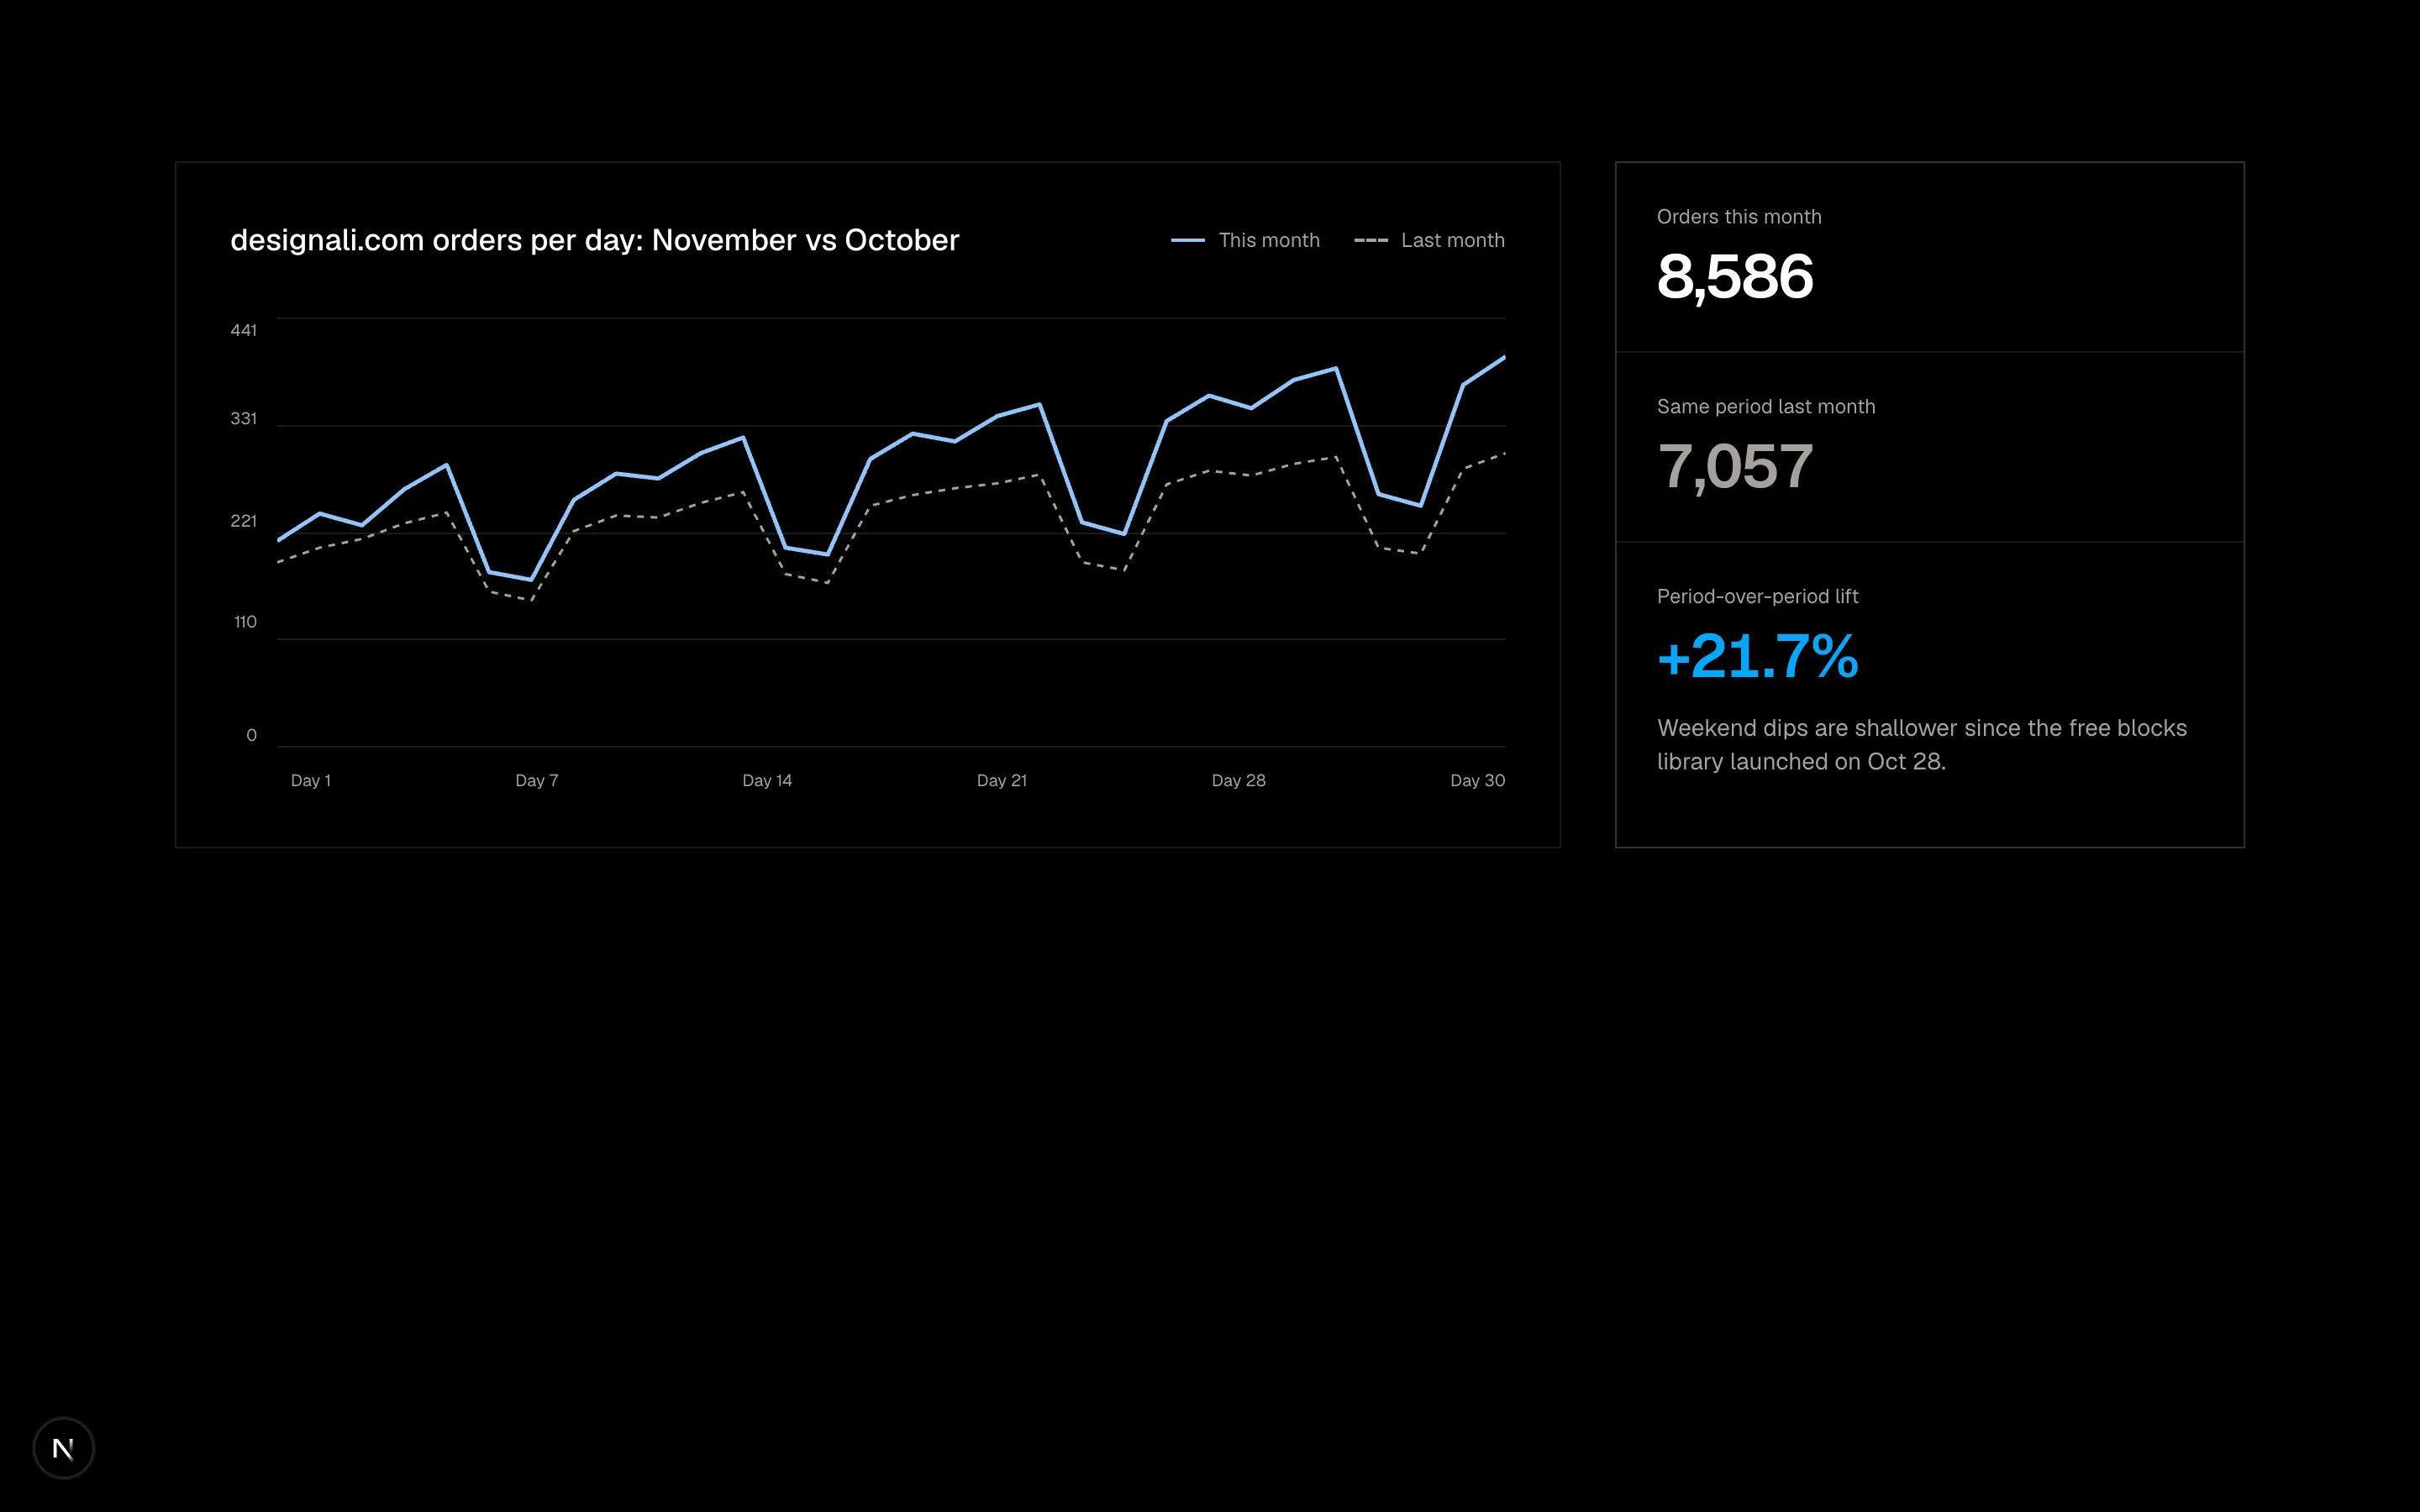
Period-over-period line chart comparing this month to last (dashed) with axis ticks beside a stacked totals panel.
analytics-13
Files
import { CounterNumber } from "@/components/ui/counter-number"

const weeks = 26
const dayLabels = ["Mon", "", "Wed", "", "Fri", "", "Sun"]

function level(week: number, day: number) {
  const base = Math.sin(week * 0.7 + day * 1.3) + Math.cos(week * 0.31 - day * 0.9)
  const weekend = day >= 5 ? -1.1 : 0
  const ramp = week / weeks
  const score = base + weekend + ramp * 1.4
  if (score < -0.8) return 0
  if (score < 0) return 1
  if (score < 0.7) return 2
  if (score < 1.4) return 3
  return 4
}

const tones = [
  "bg-muted",
  "bg-primary/20 dark:bg-primary/10",
  "bg-primary dark:bg-chart-3",
  "bg-primary dark:bg-primary",
  "bg-chart-3 dark:bg-chart-1",
]

const monthLabels = ["Jun", "Jul", "Aug", "Sep", "Oct", "Nov"]

export function Analytics14() {
  const grid = Array.from({ length: weeks }, (_, w) =>
    Array.from({ length: 7 }, (_, d) => level(w, d))
  )
  const activeDays = grid.flat().filter((l) => l > 0).length

  return (
    <section className="w-full bg-background py-16 text-foreground md:py-24">
      <div className="mx-auto max-w-5xl px-6">
        <div className="flex flex-col gap-4 sm:flex-row sm:items-end sm:justify-between">
          <div>
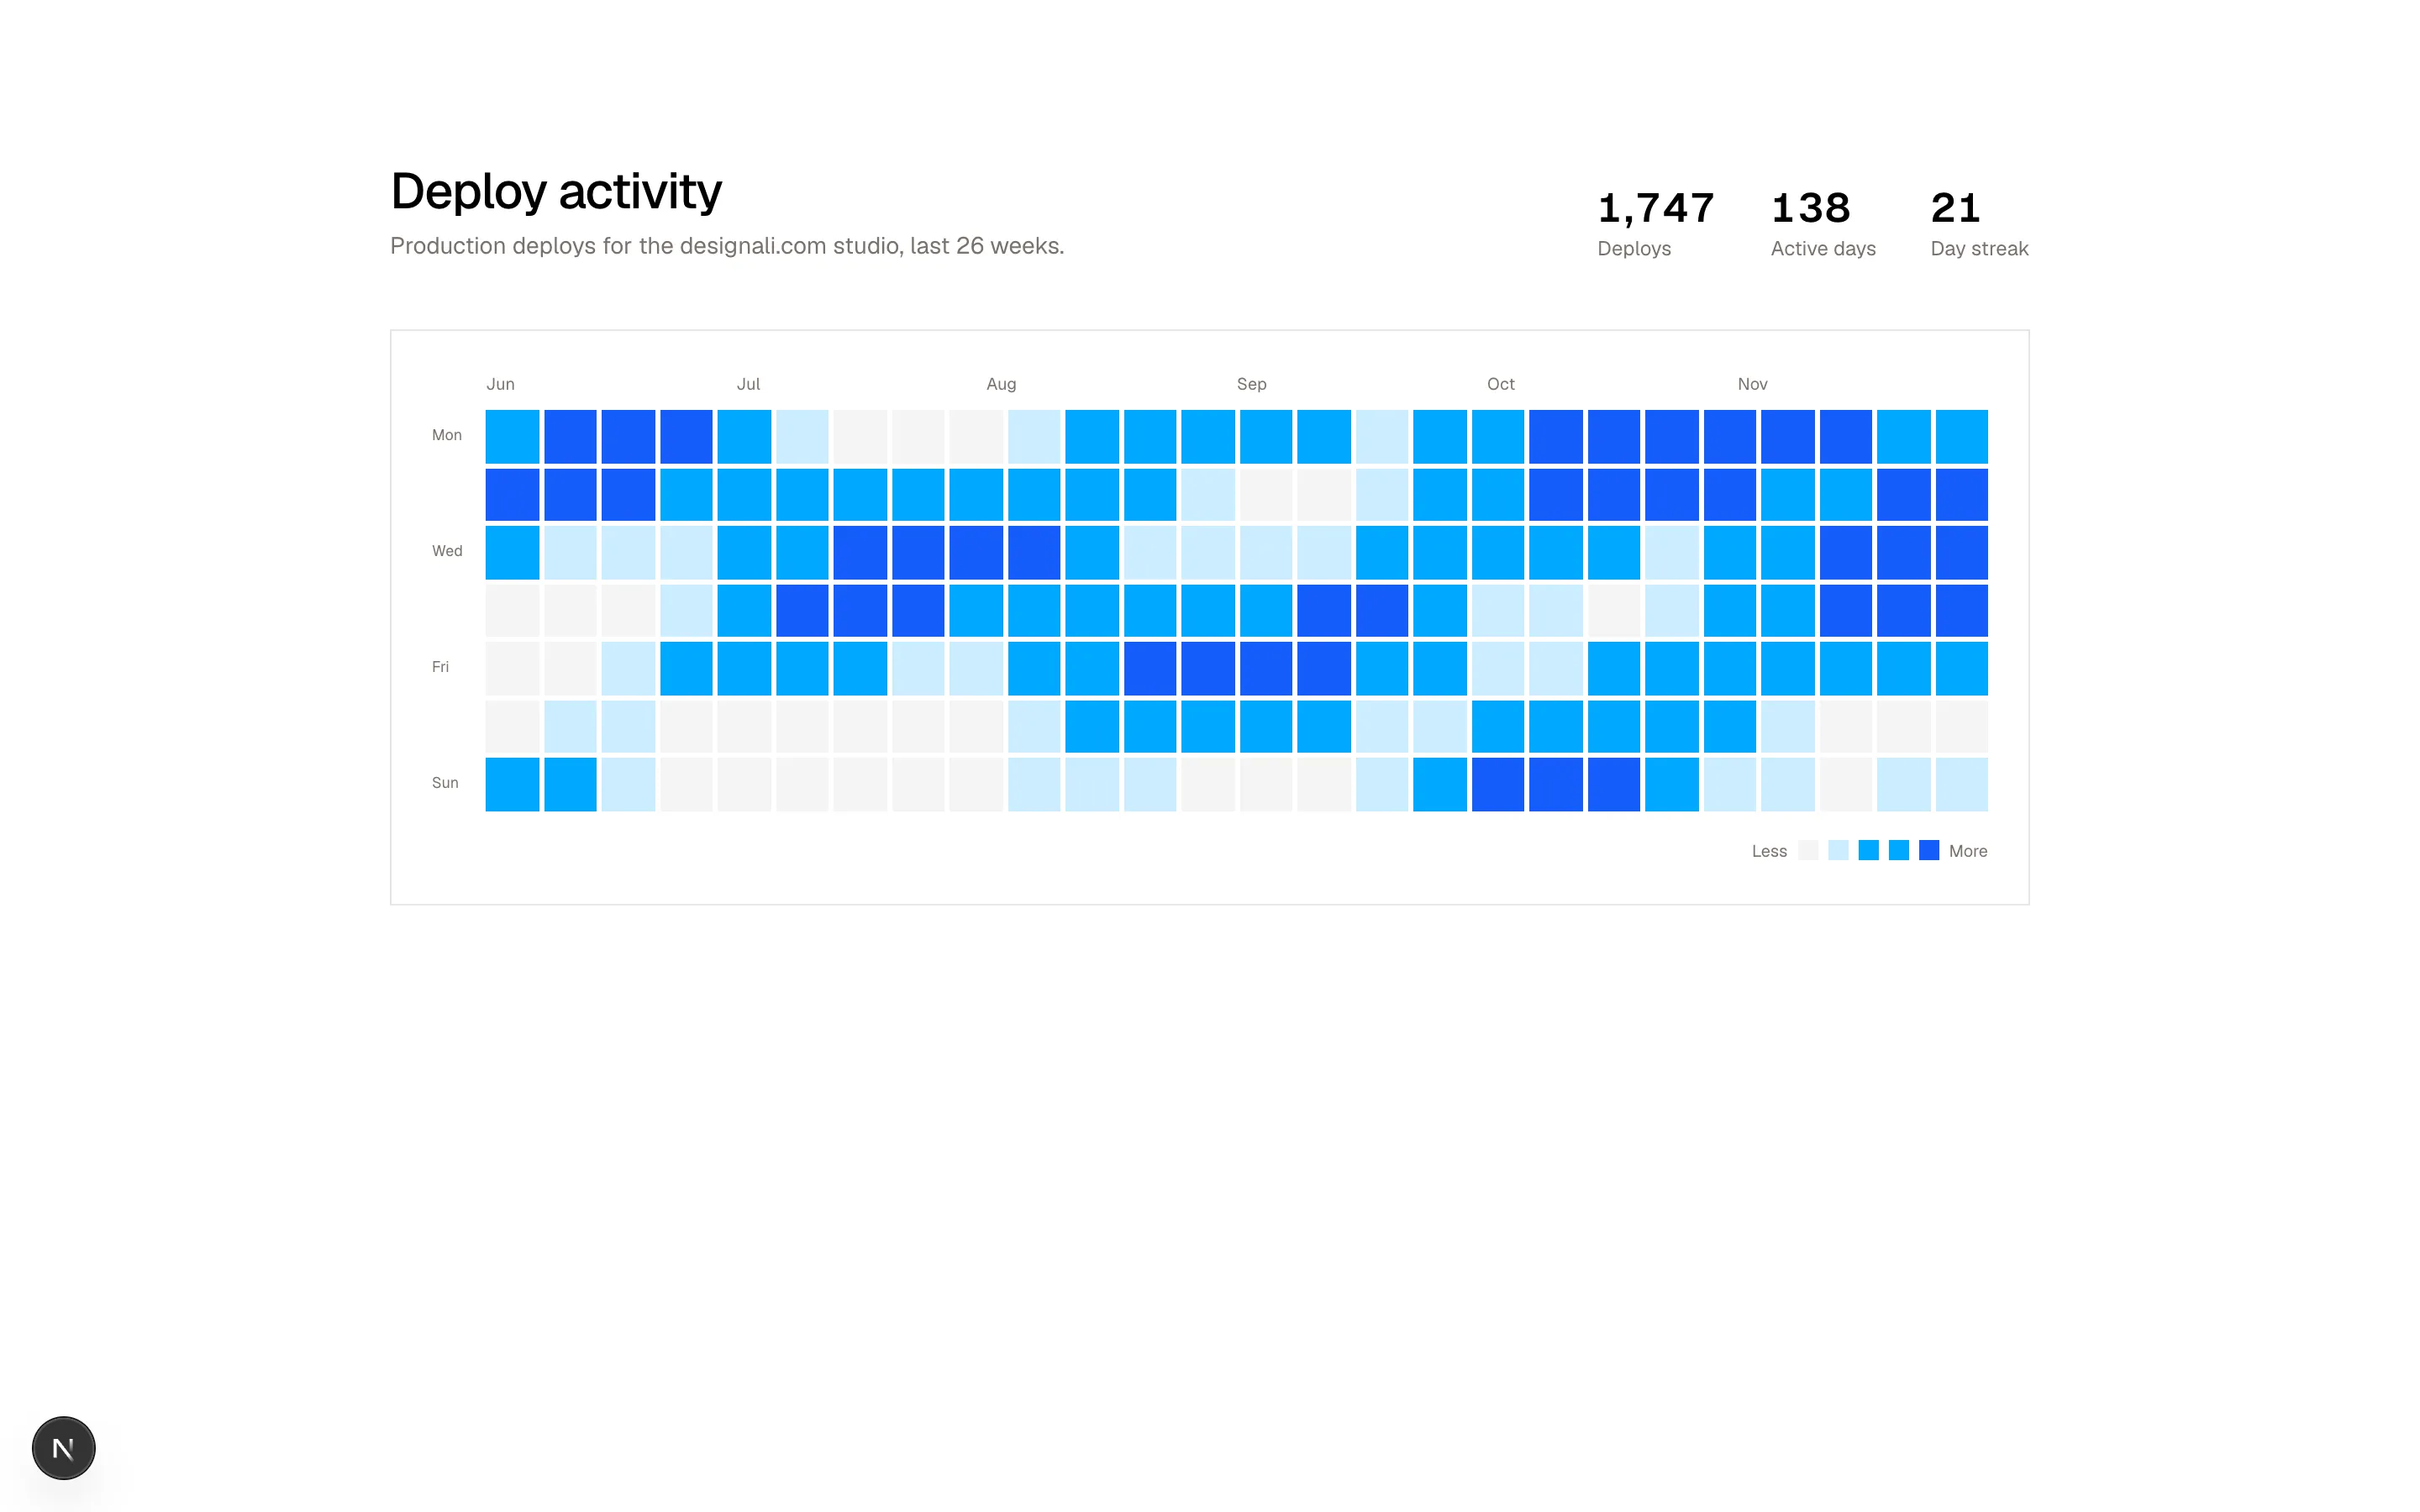
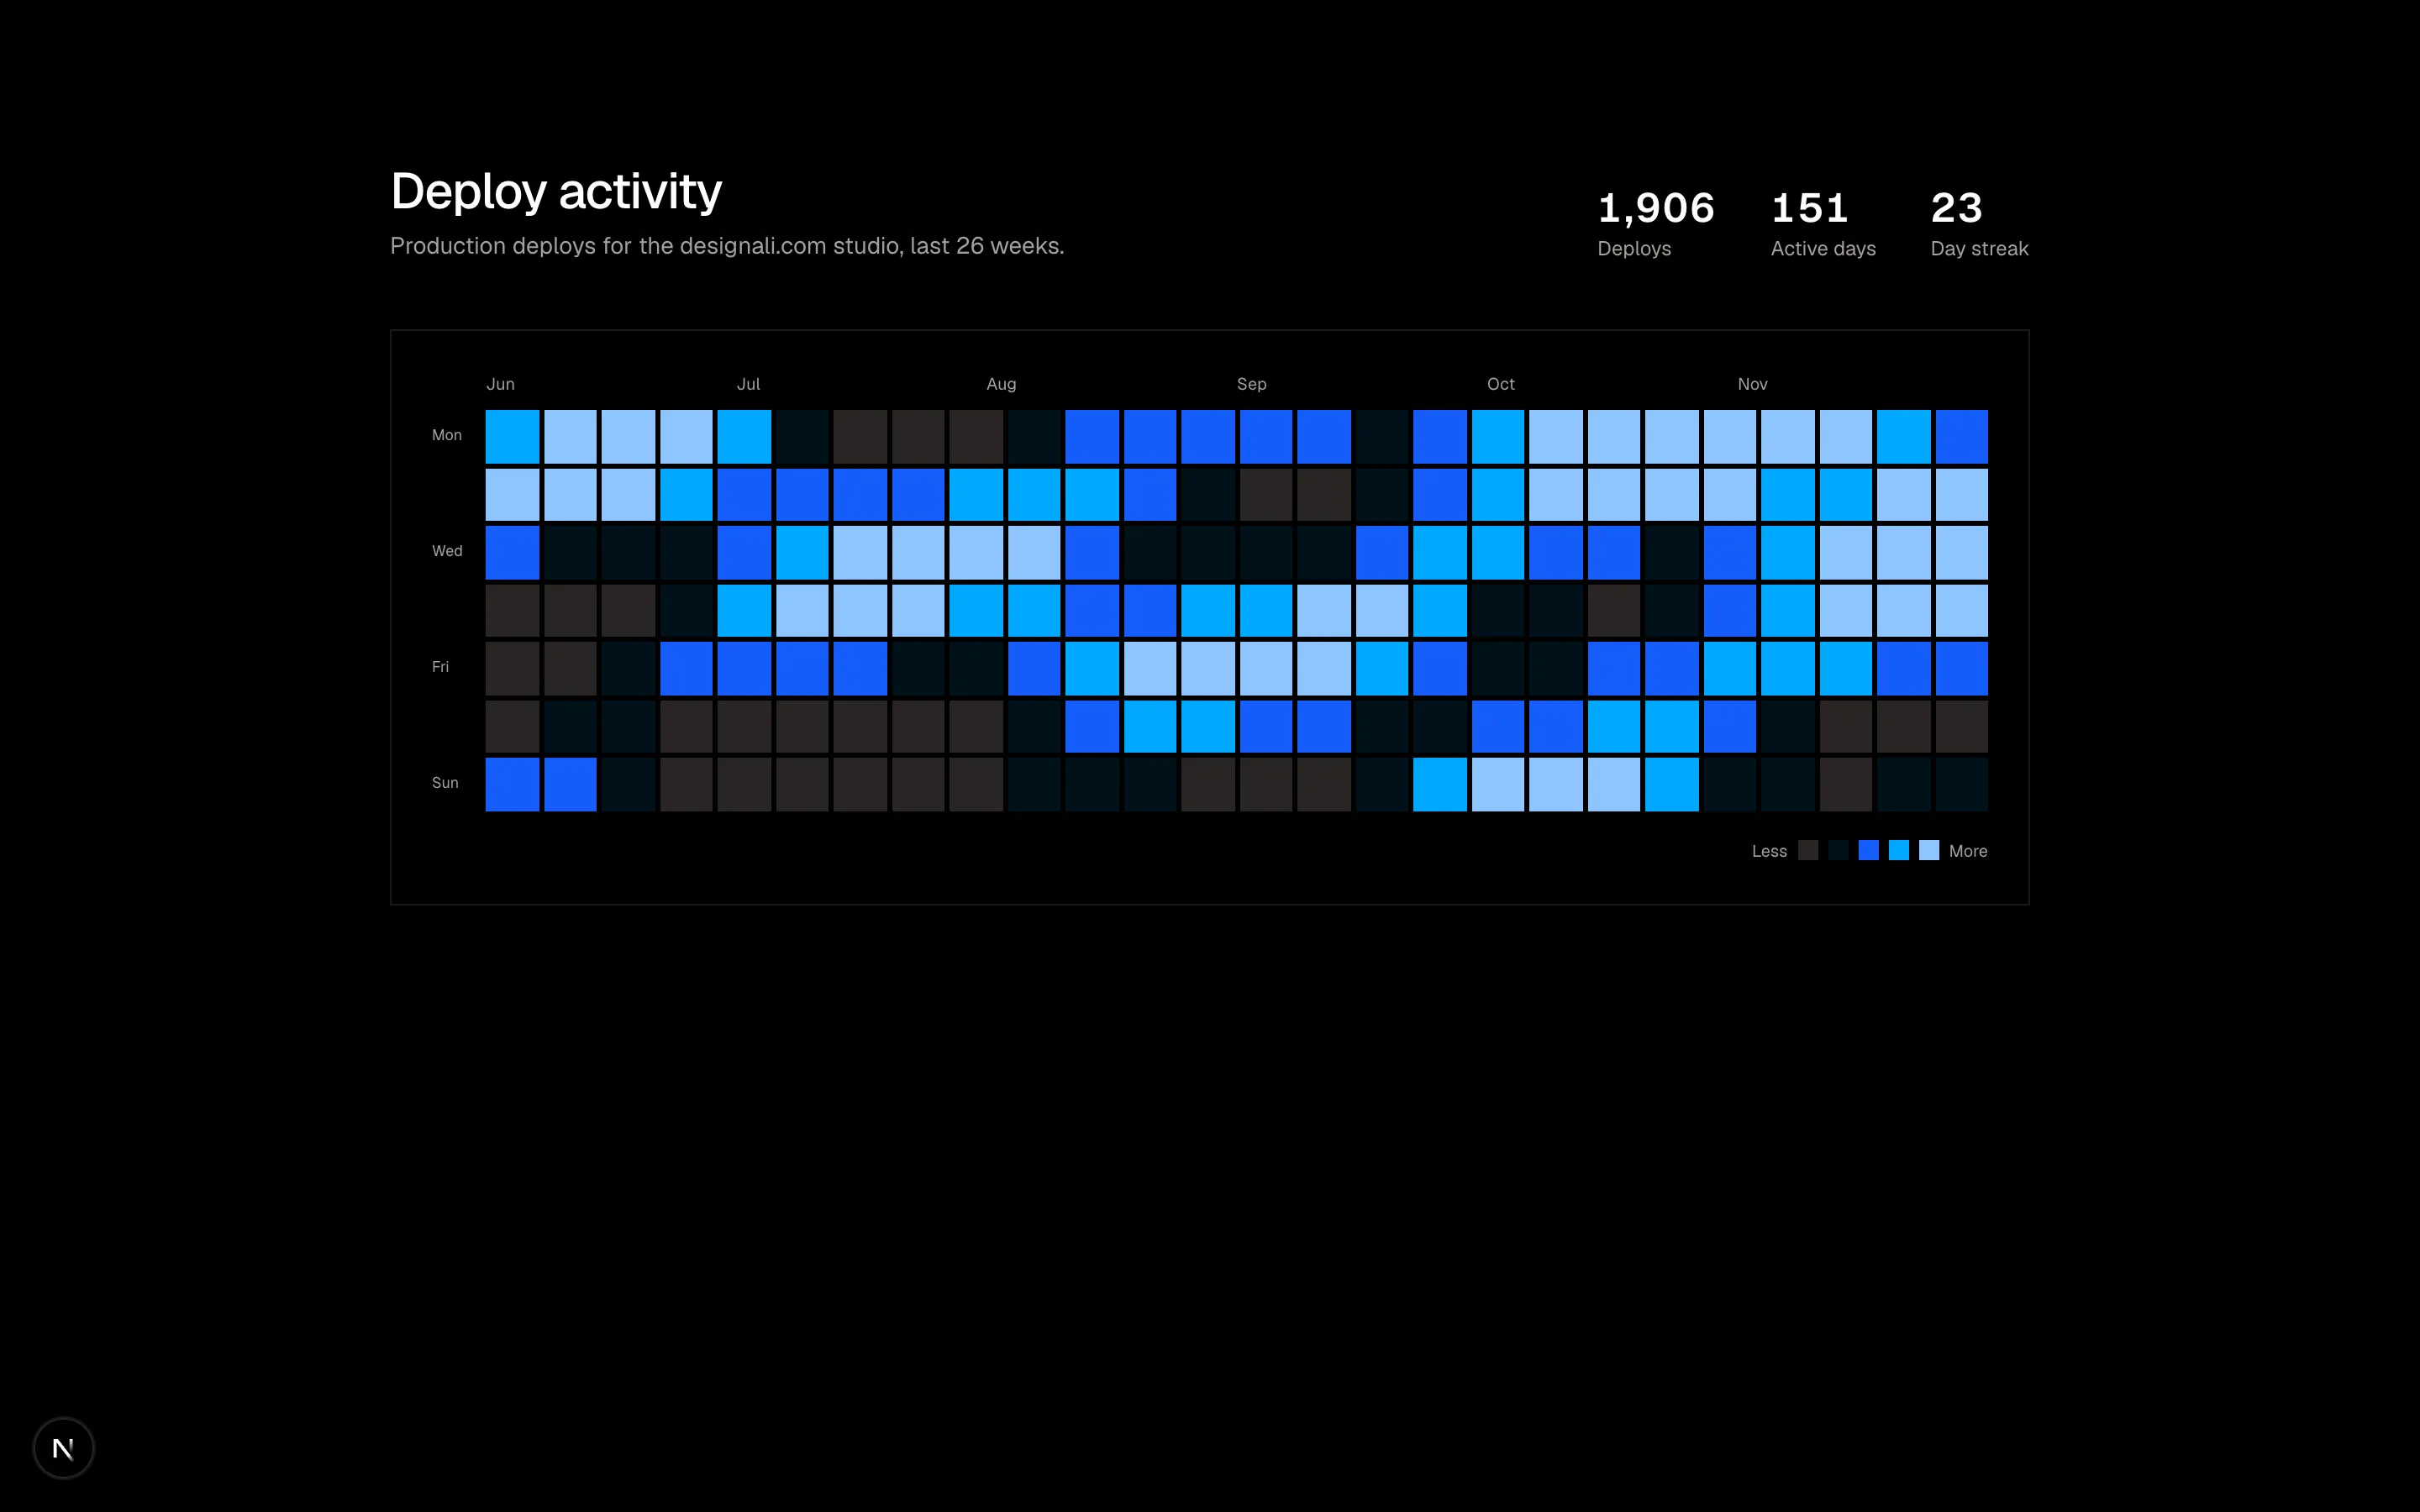
            <h2 className="text-2xl font-medium tracking-tight md:text-3xl">Deploy activity</h2>
            <p className="mt-1 text-sm text-muted-foreground">
              Production deploys for the designali.com studio, last 26 weeks.
            </p>
          </div>
          <div className="flex gap-8 text-sm">
            <div>
              <CounterNumber value={1906} className="block text-2xl font-semibold" />
              <p className="text-xs text-muted-foreground">Deploys</p>
            </div>
            <div>
              <CounterNumber value={activeDays} className="block text-2xl font-semibold" />
              <p className="text-xs text-muted-foreground">Active days</p>
            </div>
            <div>
              <CounterNumber value={23} className="block text-2xl font-semibold" />
              <p className="text-xs text-muted-foreground">Day streak</p>
            </div>
          </div>
        </div>

        <div className="mt-10 border p-4 md:p-6">
          <div className="mb-2 ml-8 grid grid-cols-6 text-[10px] text-muted-foreground">
            {monthLabels.map((m) => (
              <span key={m}>{m}</span>
            ))}
          </div>
          <div className="flex gap-2">
            <div className="grid w-6 shrink-0 grid-rows-7 gap-[3px] text-[9px] leading-none text-muted-foreground">
              {dayLabels.map((d, i) => (
                <span key={i} className="flex items-center">
                  {d}
                </span>
              ))}
            </div>
            <div
              className="grid min-w-0 flex-1 grid-flow-col grid-rows-7 gap-[3px]"
              style={{ gridTemplateColumns: `repeat(${weeks}, minmax(0, 1fr))` }}
            >
              {grid.map((week, w) =>
                week.map((l, d) => (
                  <div
                    key={`${w}-${d}`}
                    title={`Week ${w + 1}, ${["Mon", "Tue", "Wed", "Thu", "Fri", "Sat", "Sun"][d]}: level ${l}`}
                    className={`aspect-square w-full ${tones[l]}`}
                  />
                ))
              )}
            </div>
          </div>
          <div className="mt-4 flex items-center justify-end gap-1.5 text-[10px] text-muted-foreground">
            <span>Less</span>
            {tones.map((t) => (
              <span key={t} className={`size-3 ${t}`} />
            ))}
            <span>More</span>
          </div>
        </div>
      </div>
    </section>
  )
}
GitHub-style activity heatmap of daily deploys over 26 weeks with headline stats and an intensity legend.
analytics-14
Files
import { IPhone } from "@/components/ui/apple/iphone"
import { Macbook } from "@/components/ui/apple/macbook"

const devices = [
  { key: "desktop", label: "Desktop", color: "var(--chart-1)" },
  { key: "mobile", label: "Mobile", color: "var(--chart-2)" },
  { key: "tablet", label: "Tablet", color: "var(--chart-3)" },
  { key: "app", label: "Native app", color: "var(--chart-4)" },
] as const

const months: { month: string; desktop: number; mobile: number; tablet: number; app: number }[] = [
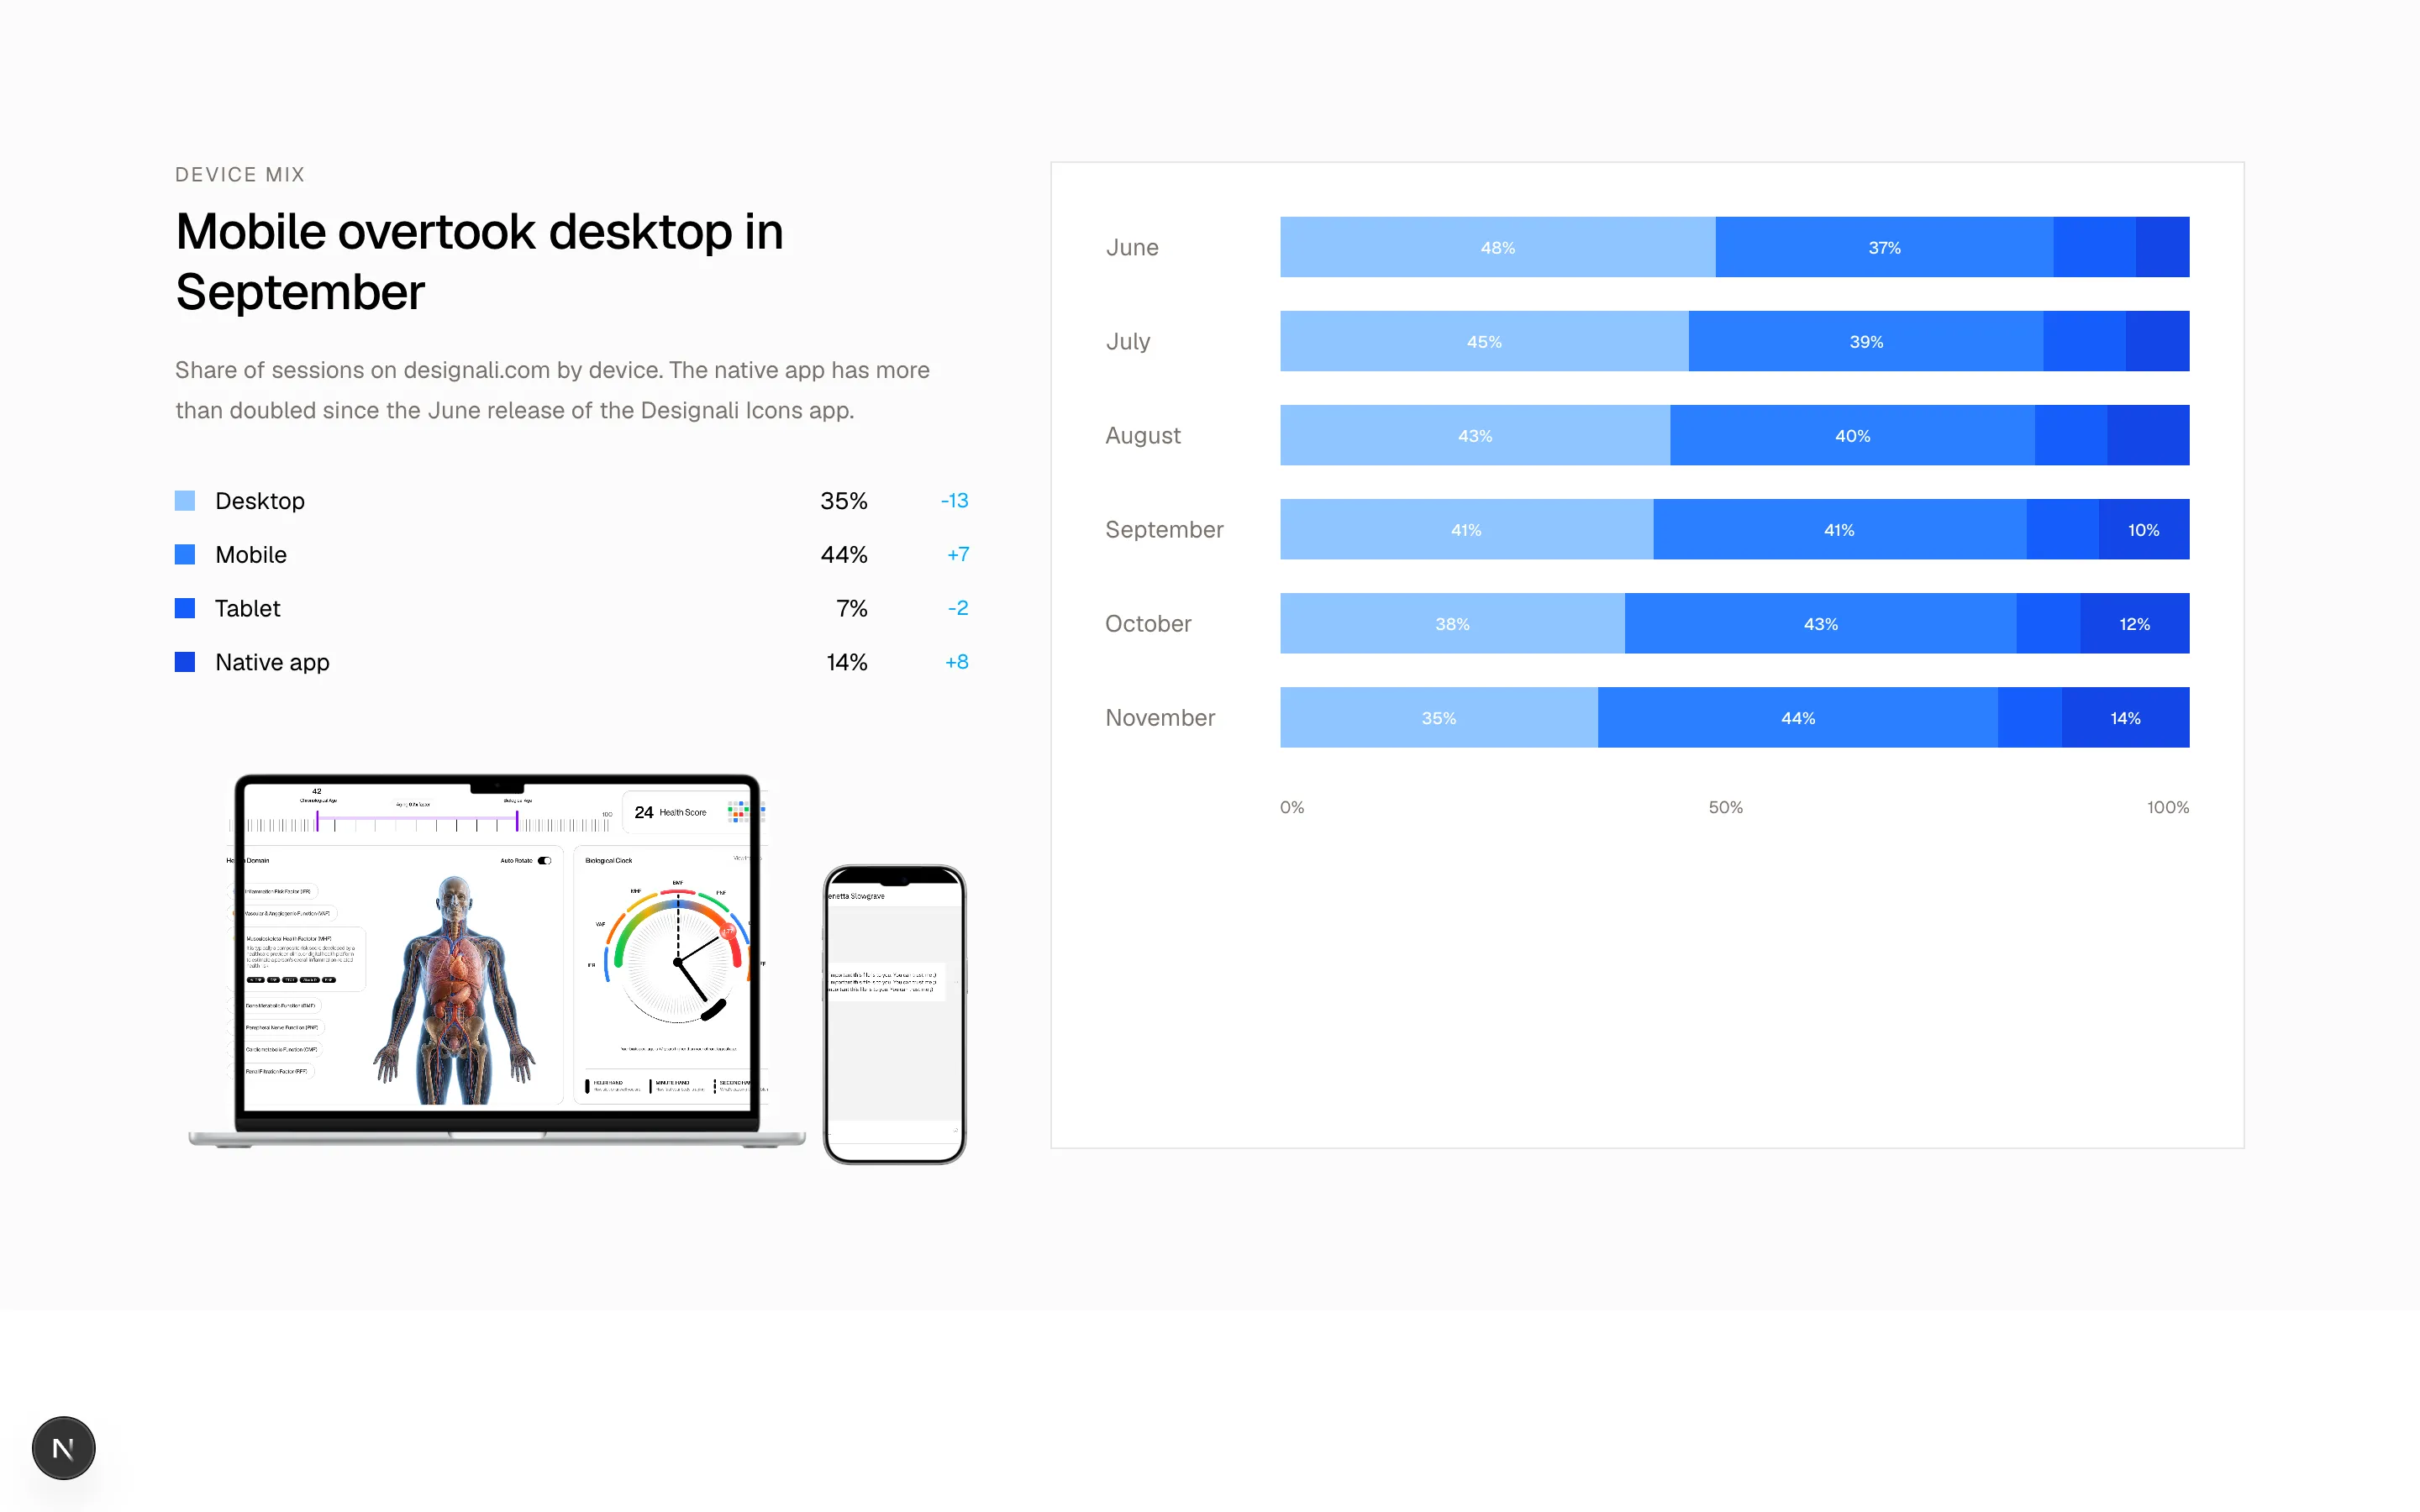
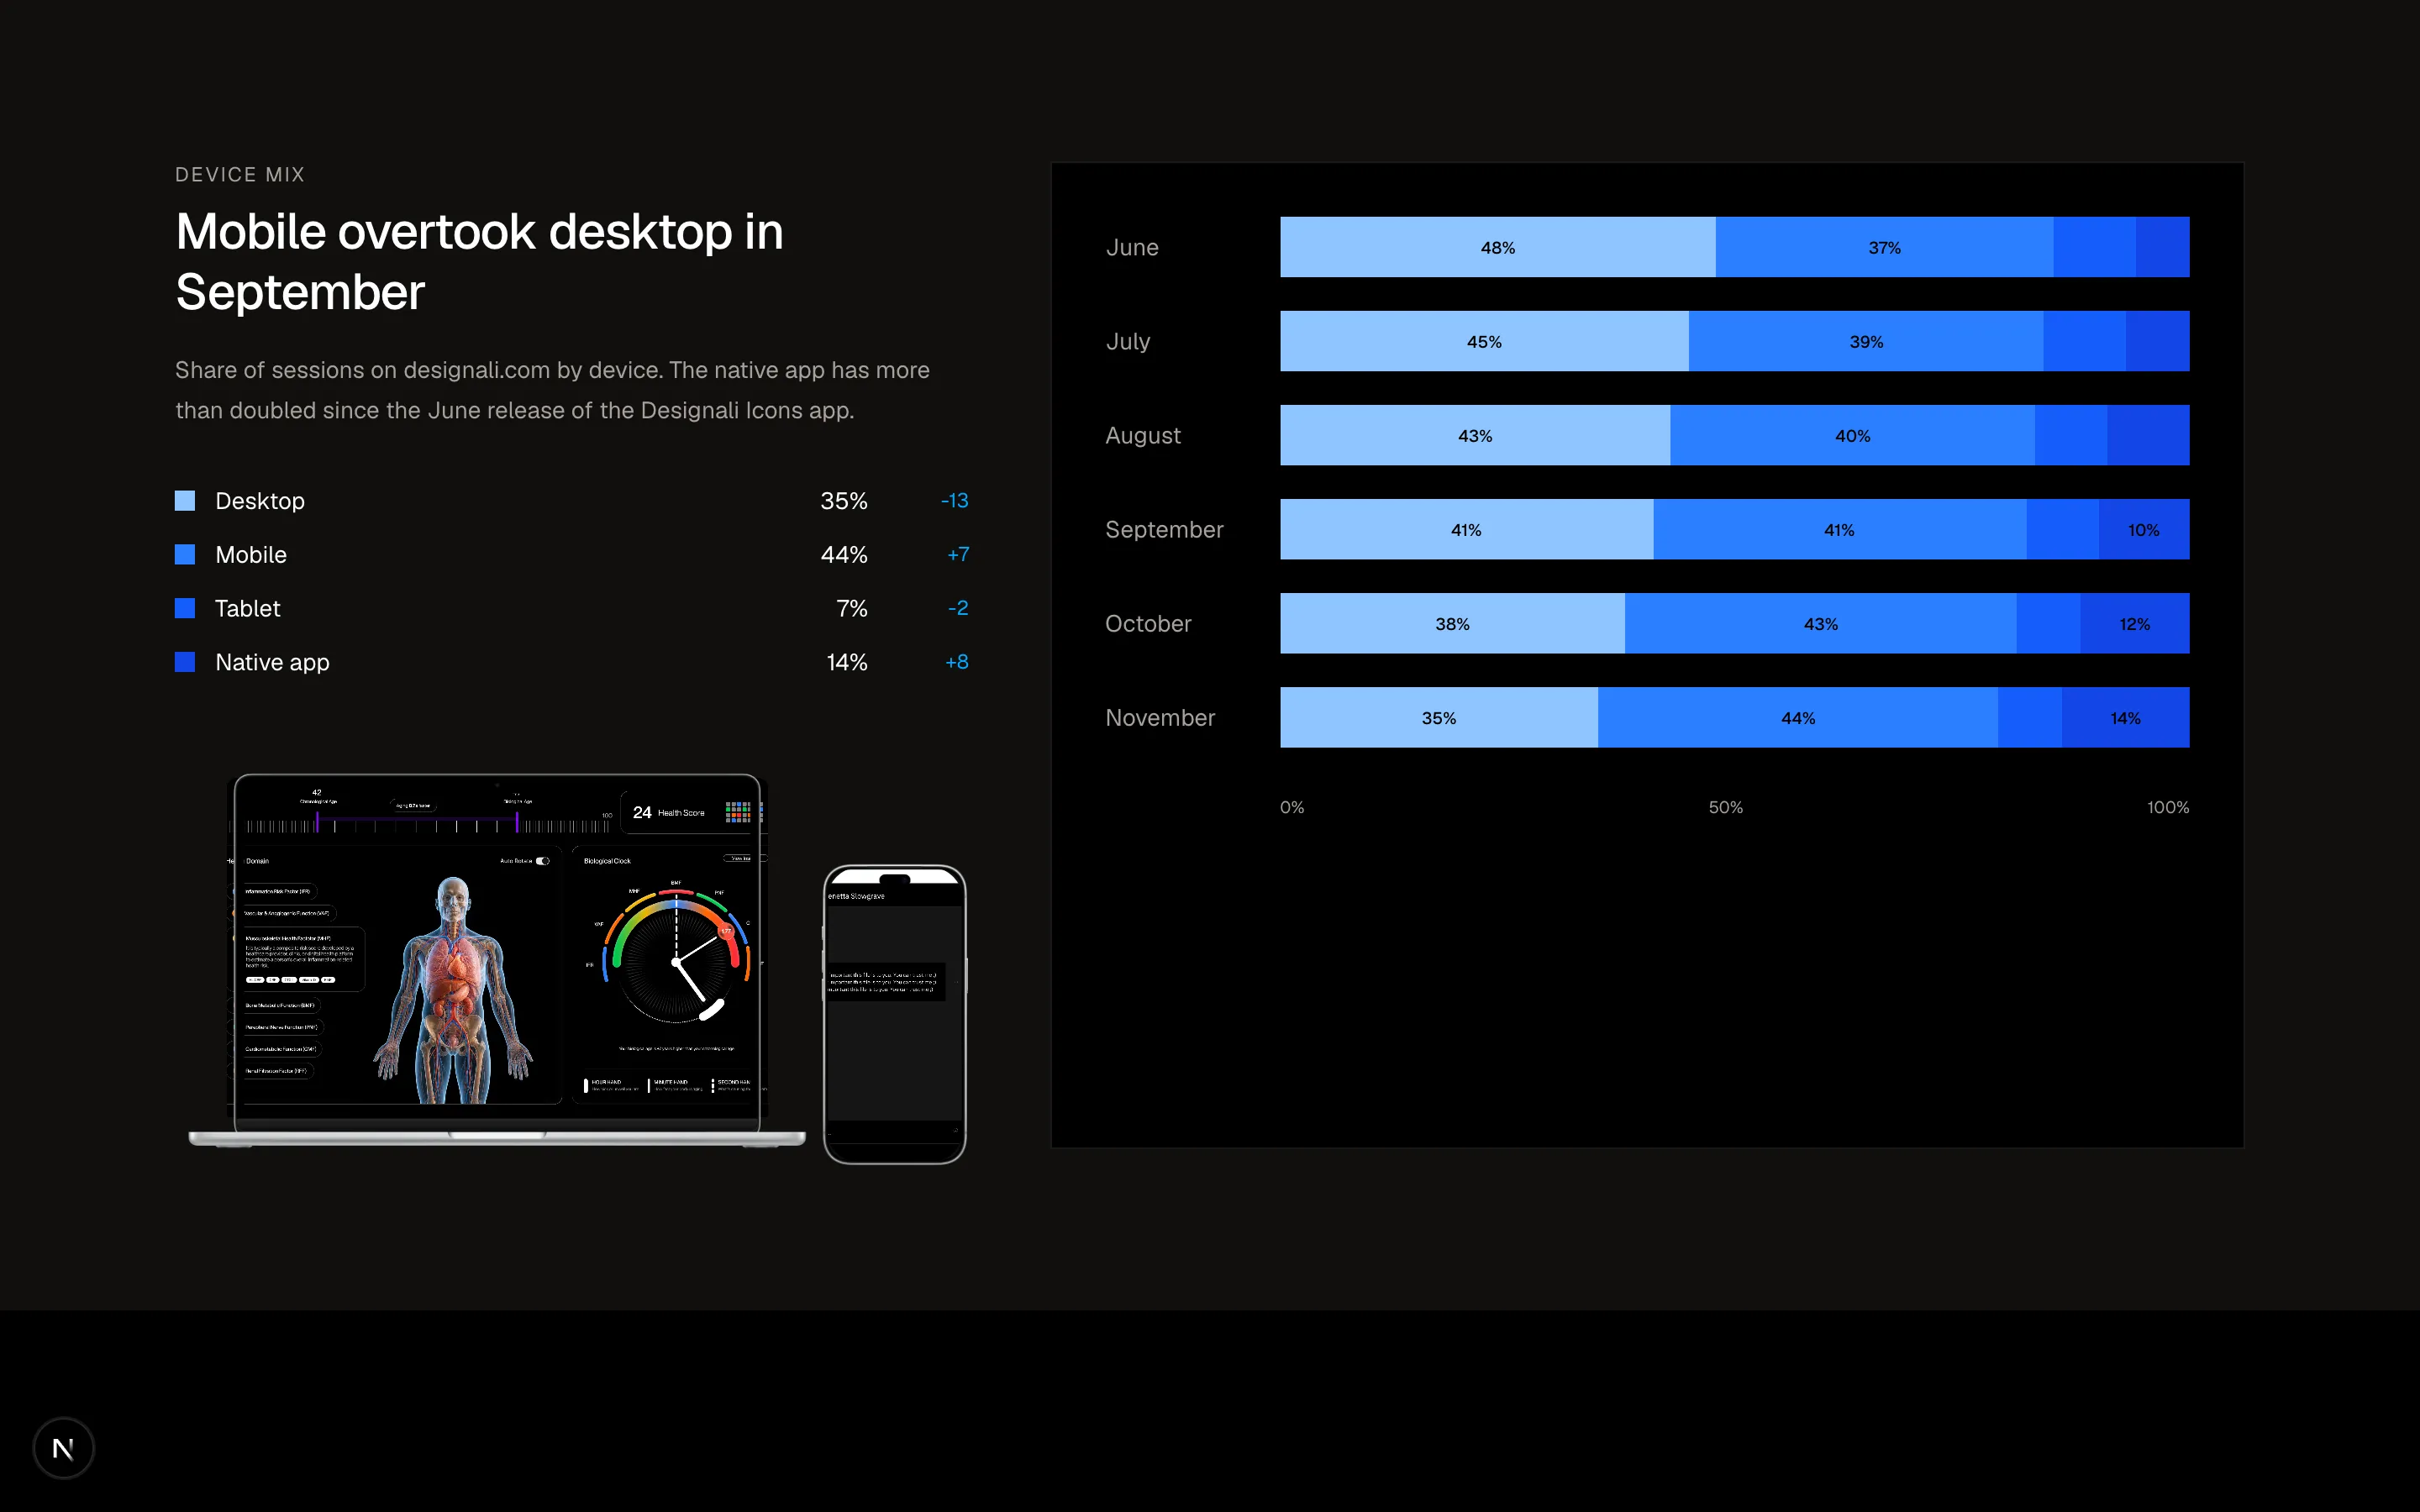
  { month: "June", desktop: 48, mobile: 37, tablet: 9, app: 6 },
  { month: "July", desktop: 45, mobile: 39, tablet: 9, app: 7 },
  { month: "August", desktop: 43, mobile: 40, tablet: 8, app: 9 },
  { month: "September", desktop: 41, mobile: 41, tablet: 8, app: 10 },
  { month: "October", desktop: 38, mobile: 43, tablet: 7, app: 12 },
  { month: "November", desktop: 35, mobile: 44, tablet: 7, app: 14 },
]

export function Analytics15() {
  return (
    <section className="w-full bg-muted/40 py-16 text-foreground md:py-24">
      <div className="mx-auto max-w-7xl px-6">
        <div className="grid gap-12 lg:grid-cols-[1fr_2fr]">
          <div className="lg:sticky lg:top-24 lg:self-start">
            <p className="text-xs tracking-widest text-muted-foreground uppercase">Device mix</p>
            <h2 className="mt-2 text-3xl font-medium tracking-tight">
              Mobile overtook desktop in September
            </h2>
            <p className="mt-4 text-sm leading-6 text-muted-foreground">
              Share of sessions on designali.com by device. The native app has
              more than doubled since the June release of the Designali Icons app.
            </p>
            <ul className="mt-8 space-y-3">
              {devices.map((d) => {
                const first = months[0]?.[d.key] ?? 0
                const last = months[months.length - 1]?.[d.key] ?? 0
                const delta = last - first
                return (
                  <li key={d.key} className="flex items-center gap-3 text-sm">
                    <span className="size-3" style={{ background: d.color }} />
                    <span className="flex-1">{d.label}</span>
                    <span className="font-sans">{last}%</span>
                    <span
                      className={
                        delta >= 0
                          ? "w-12 text-right font-sans text-xs text-primary dark:text-primary"
                          : "w-12 text-right font-sans text-xs text-primary dark:text-primary"
                      }
                    >
                      {delta > 0 ? "+" : ""}
                      {delta}
                    </span>
                  </li>
                )
              })}
            </ul>
            <div className="relative mt-10 flex max-w-full items-end">
              <Macbook variant="macbook-air" color="silver" size="sm" className="max-w-full">
                <img
                  src="/img/dashboard-1-light.jpg"
                  alt="Designali dashboard on desktop"
                  className="size-full object-cover object-top dark:hidden"
                />
                <img
                  src="/img/dashboard-1-dark.jpg"
                  alt="Designali dashboard on desktop"
                  className="hidden size-full object-cover object-top dark:block"
                />
              </Macbook>
              <IPhone size="sm" color="silver" className="absolute right-0 -bottom-4 h-48!">
                <img
                  src="/img/chat-1-light.jpg"
                  alt="Designali on mobile"
                  className="size-full object-cover dark:hidden"
                />
                <img
                  src="/img/chat-1-dark.jpg"
                  alt="Designali on mobile"
                  className="hidden size-full object-cover dark:block"
                />
              </IPhone>
            </div>
          </div>

          <div className="space-y-5 border bg-background p-6 md:p-8">
            {months.map((m) => (
              <div key={m.month} className="grid grid-cols-[5.5rem_1fr] items-center gap-4">
                <span className="text-sm text-muted-foreground">{m.month}</span>
                <div className="flex h-9 w-full overflow-hidden">
                  {devices.map((d) => (
                    <div
                      key={d.key}
                      className="flex items-center justify-center text-[10px] font-medium text-background"
                      style={{ width: `${m[d.key]}%`, background: d.color }}
                      title={`${d.label}: ${m[d.key]}%`}
                    >
                      {m[d.key] >= 10 ? `${m[d.key]}%` : ""}
                    </div>
                  ))}
                </div>
              </div>
            ))}
            <div className="grid grid-cols-[5.5rem_1fr] gap-4 pt-2">
              <span />
              <div className="flex justify-between font-sans text-[10px] text-muted-foreground">
                <span>0%</span>
                <span>50%</span>
                <span>100%</span>
              </div>
            </div>
          </div>
        </div>
      </div>
    </section>
  )
}
Sticky device-mix summary beside 100% stacked horizontal bars per month with in-bar labels.
analytics-15
Files
"use client"

import { useState } from "react"

import { cn } from "@/lib/utils"

const campaigns = [
  { name: "Designali Icons launch", channel: "Social", spend: 18, roas: 4.6, orders: 1240 },
  { name: "Designali brand search", channel: "Search", spend: 32, roas: 6.1, orders: 3120 },
  { name: "Templates carousel", channel: "Social", spend: 12, roas: 3.2, orders: 610 },
  { name: "Design podcast spot", channel: "Audio", spend: 24, roas: 1.4, orders: 280 },
  { name: "21st.dev affiliates", channel: "Affiliate", spend: 9, roas: 5.3, orders: 720 },
  { name: "UI blocks search", channel: "Search", spend: 41, roas: 2.2, orders: 1450 },
  { name: "UI kit bundles", channel: "Social", spend: 15, roas: 2.8, orders: 530 },
  { name: "Newsletter swap", channel: "Affiliate", spend: 5, roas: 3.9, orders: 210 },
  { name: "YouTube pre-roll test", channel: "Audio", spend: 36, roas: 0.9, orders: 190 },
]

const channelColor: Record<string, string> = {
  Social: "var(--chart-1)",
  Search: "var(--chart-2)",
  Audio: "var(--chart-4)",
  Affiliate: "var(--chart-3)",
}

const maxSpend = 45
const maxRoas = 7

export function Analytics16() {
  const [selected, setSelected] = useState<string | null>("Designali brand search")
  const active = campaigns.find((c) => c.name === selected)

  return (
    <section className="w-full bg-background py-16 text-foreground md:py-24">
      <div className="mx-auto max-w-7xl px-6">
        <div className="max-w-2xl">
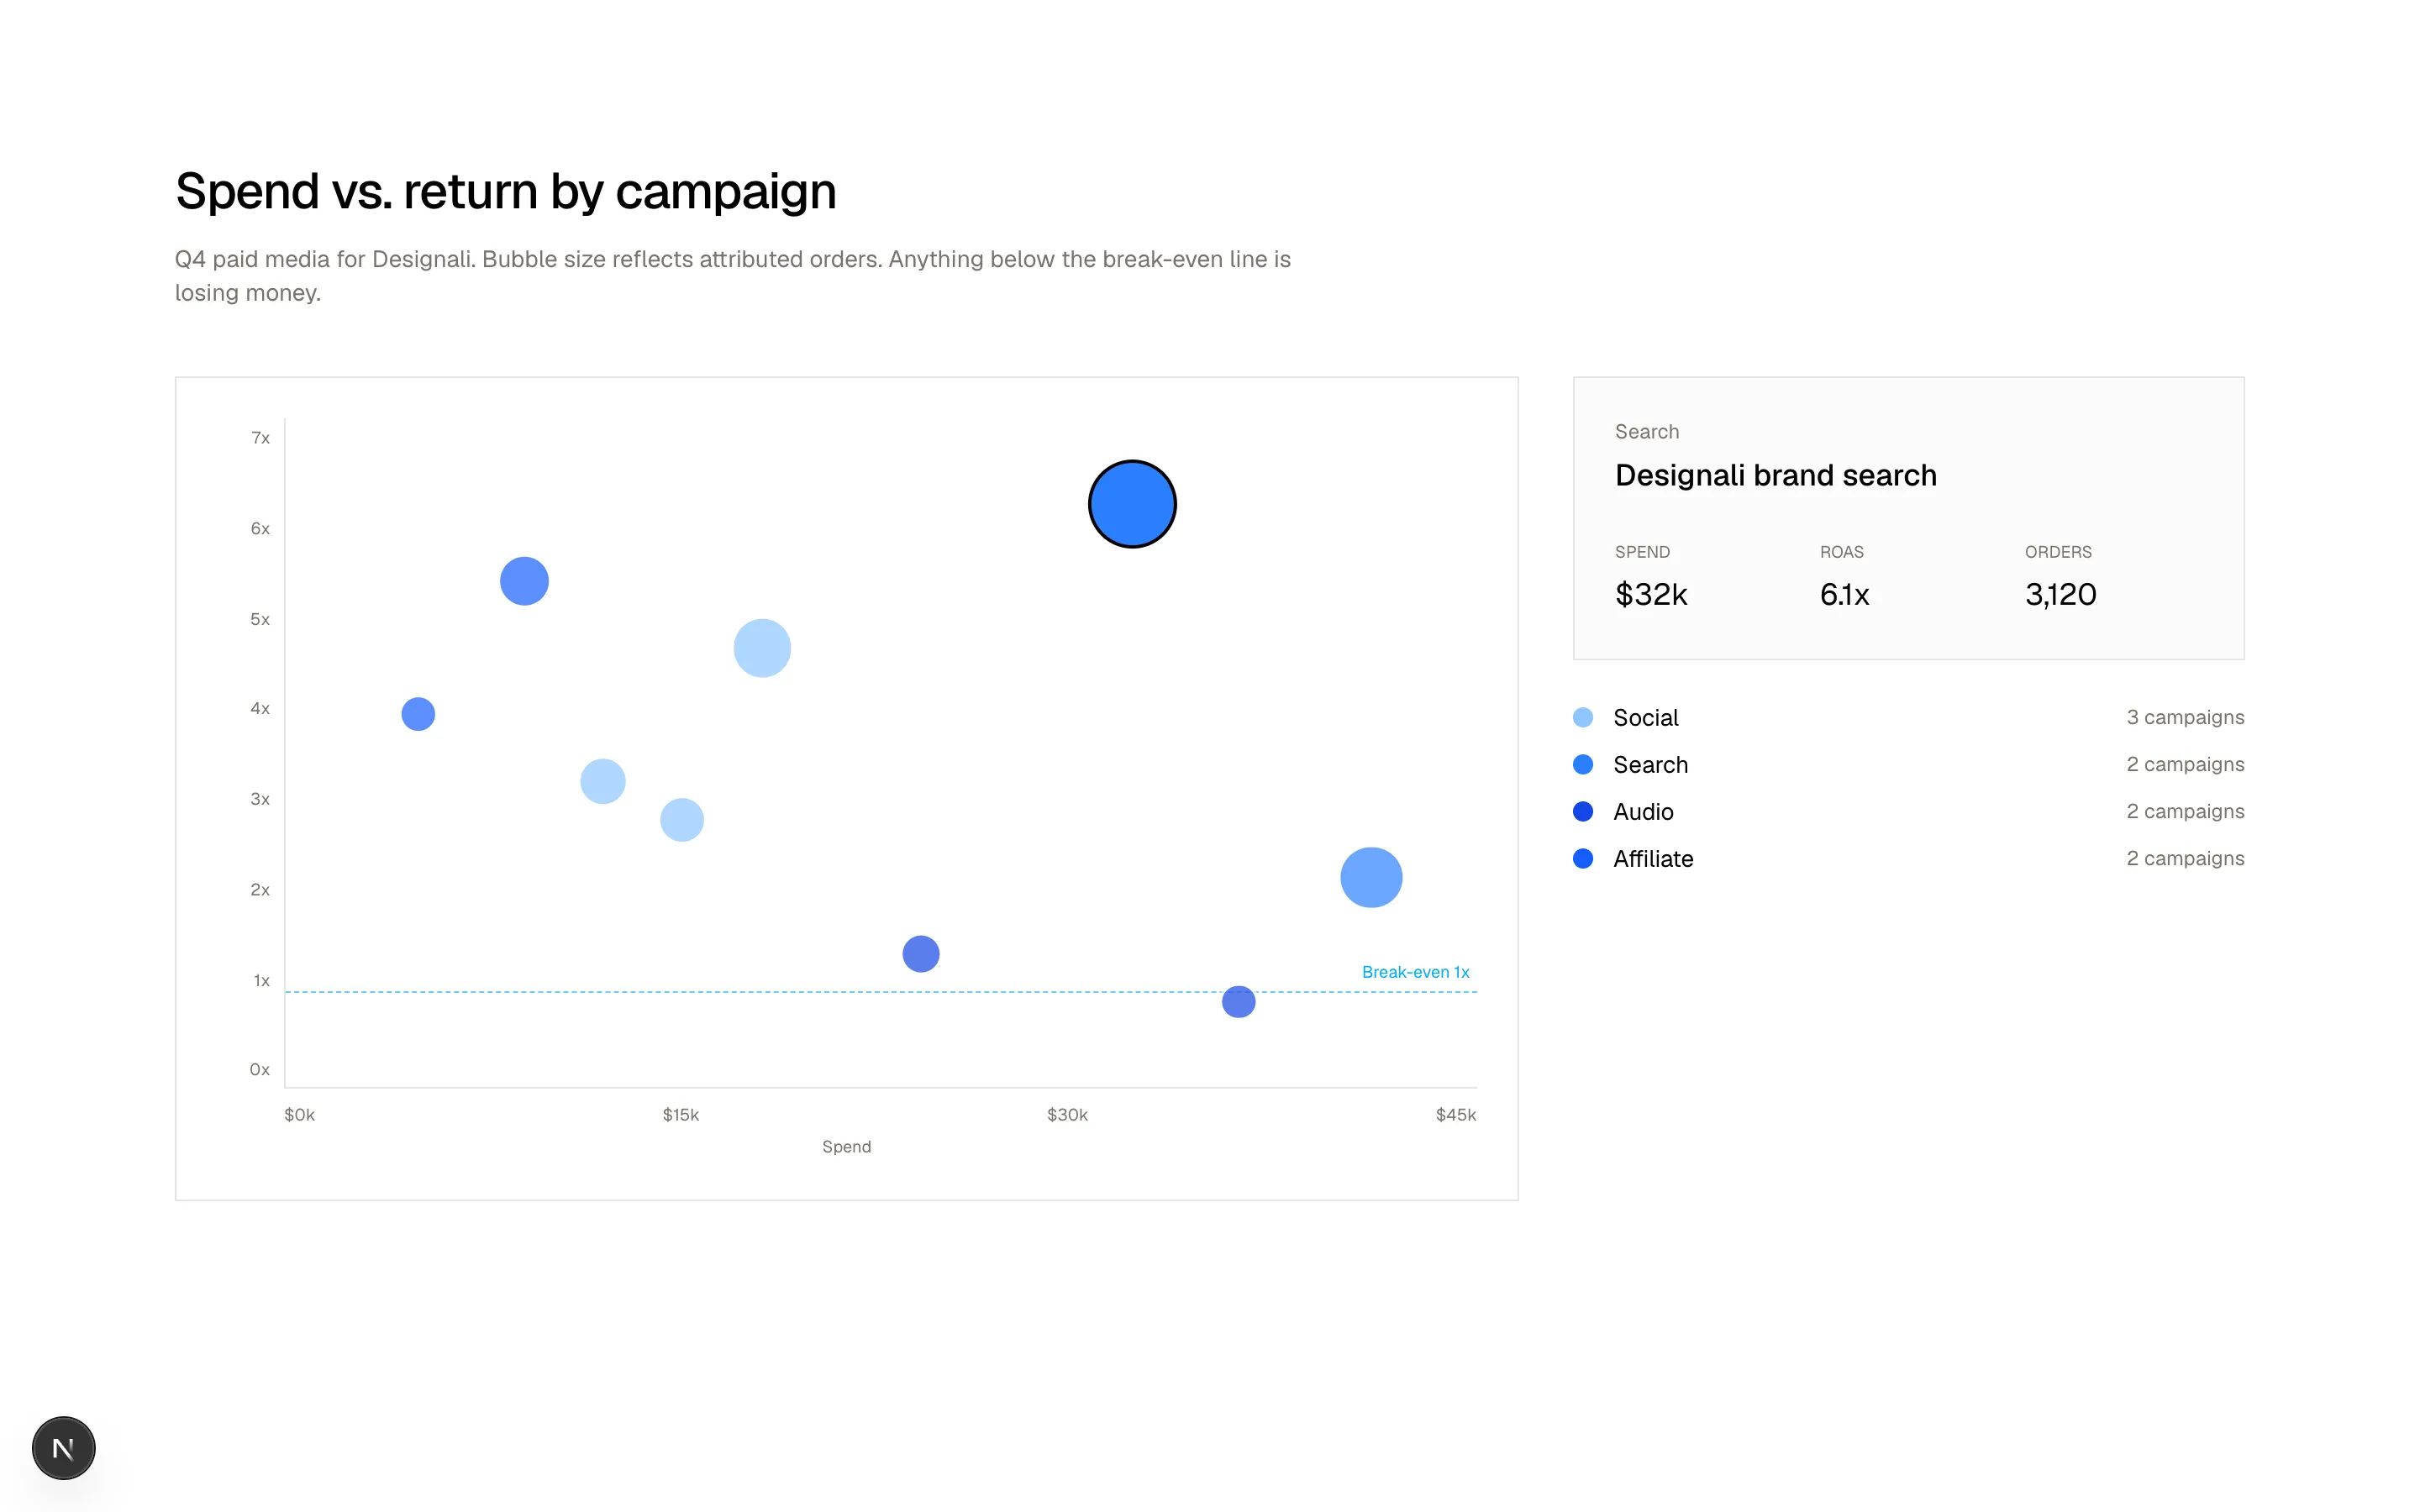
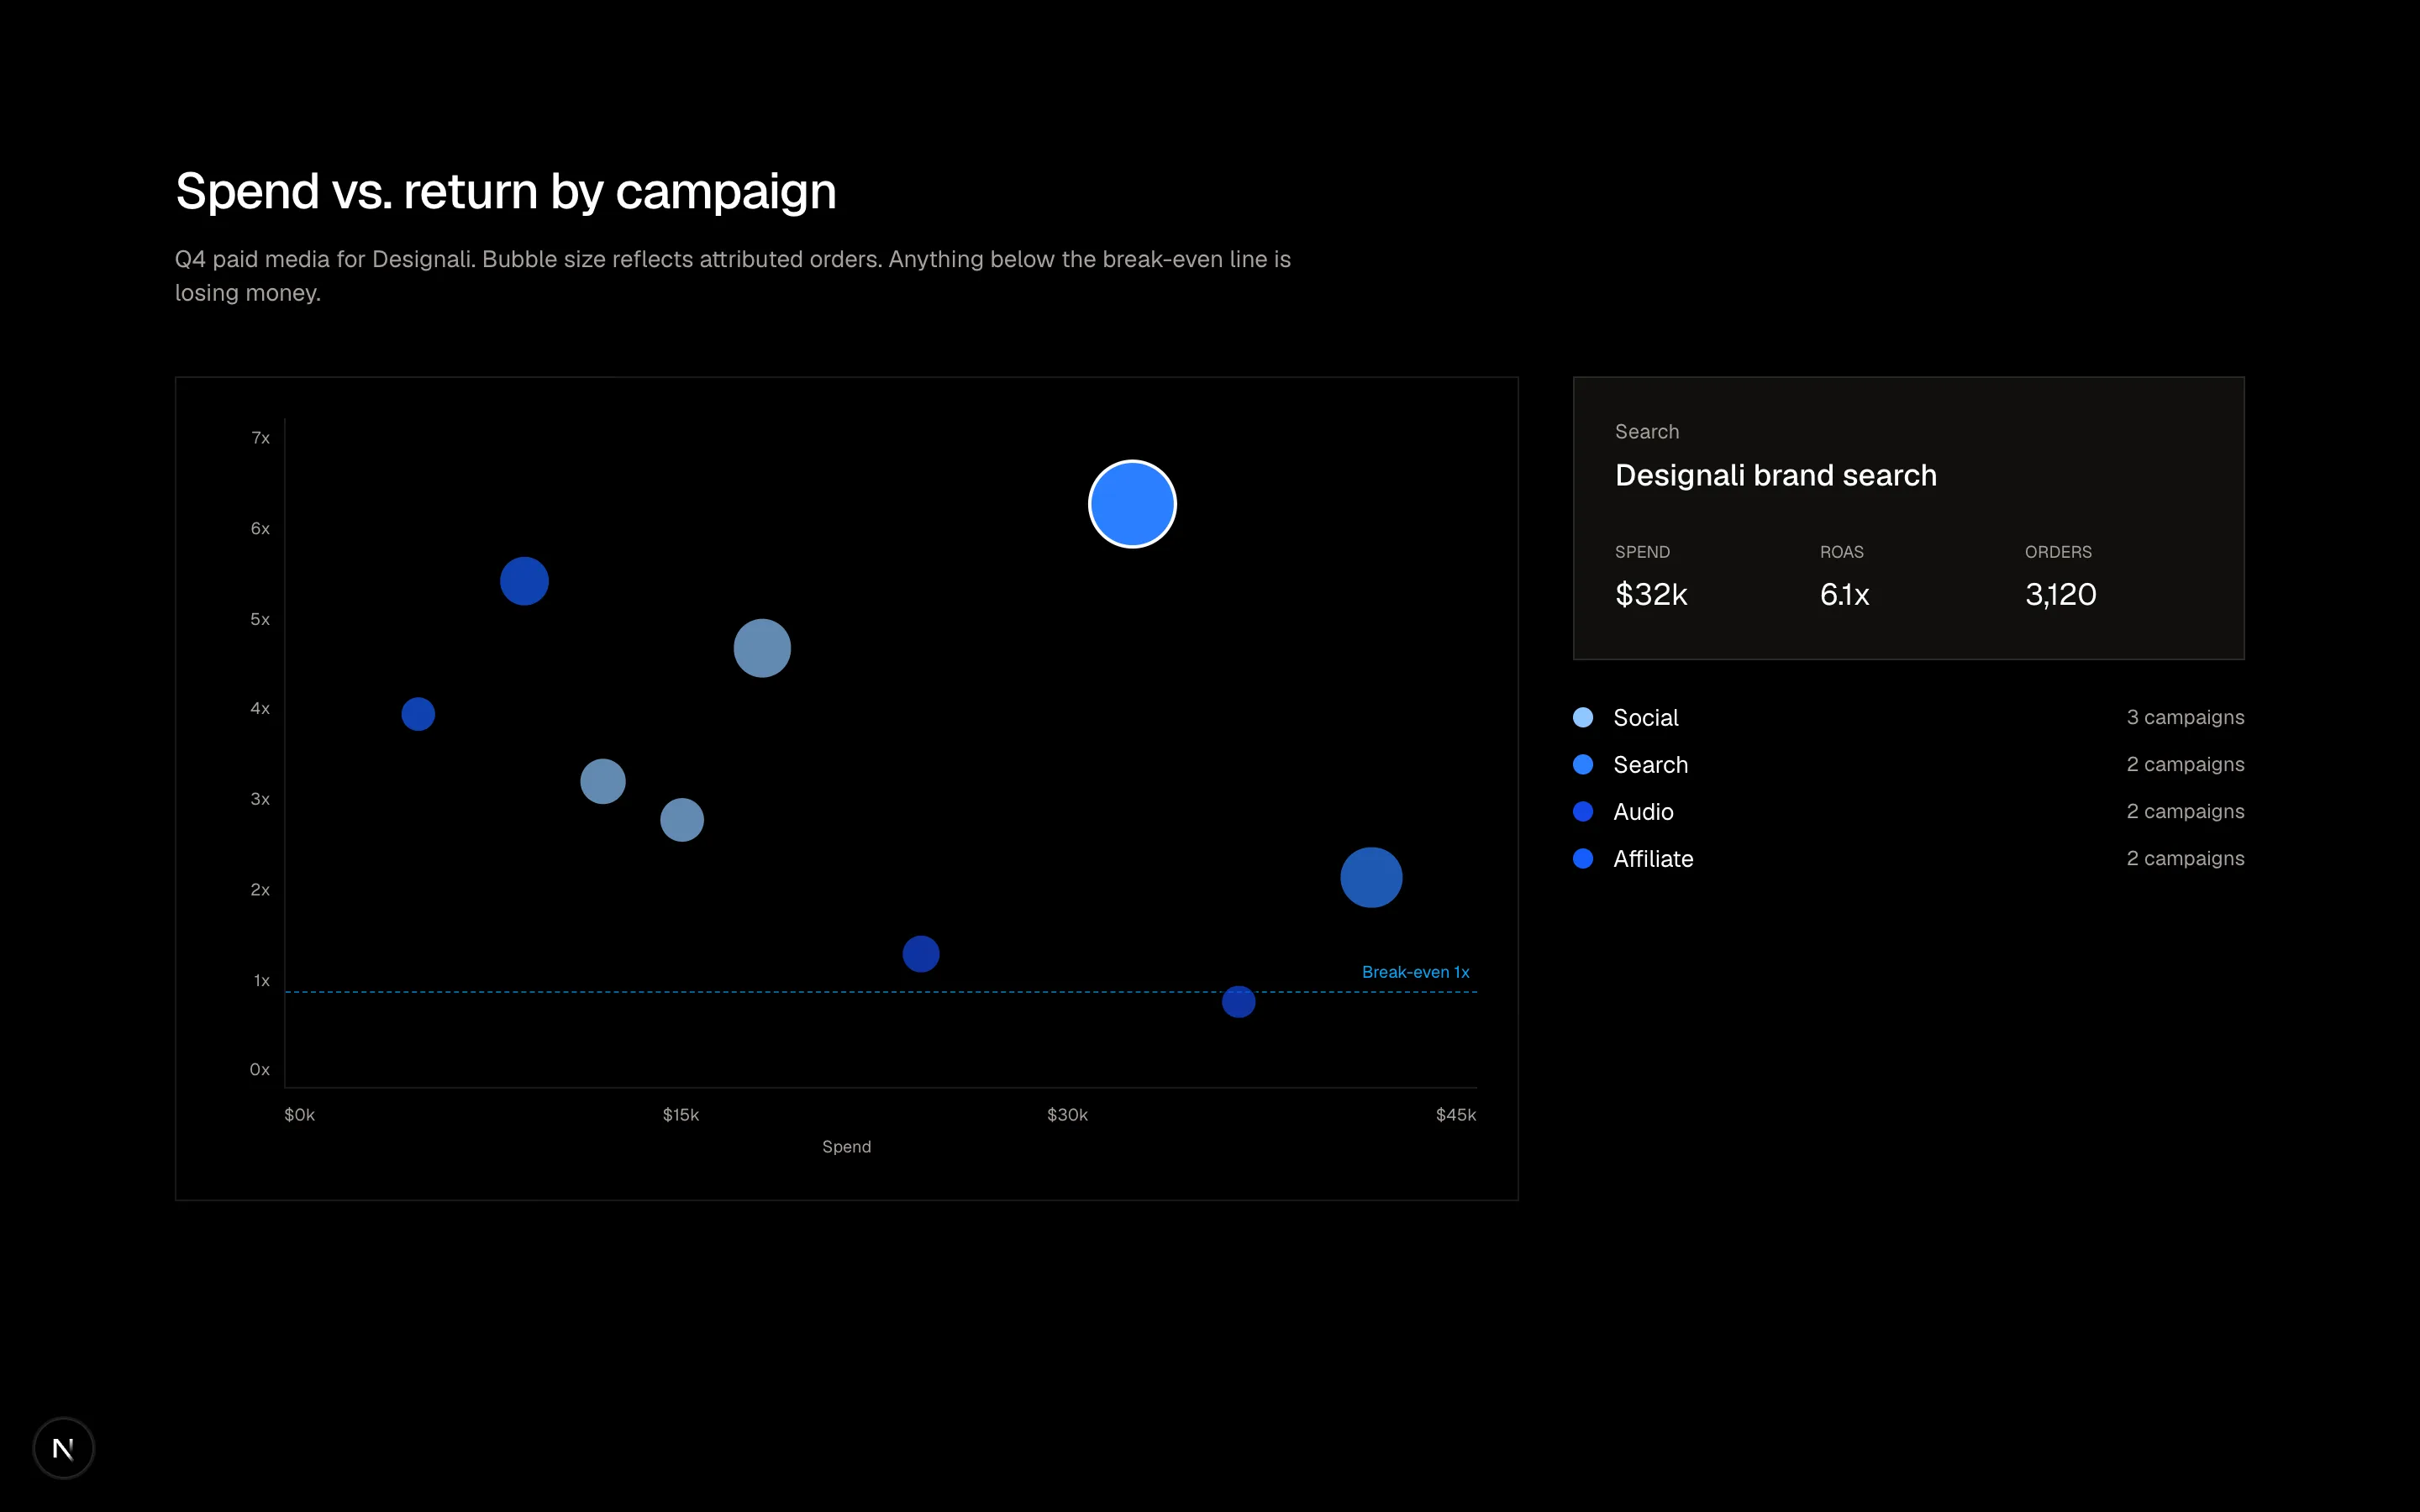
          <h2 className="text-3xl font-medium tracking-tight">Spend vs. return by campaign</h2>
          <p className="mt-3 text-sm text-muted-foreground">
            Q4 paid media for Designali. Bubble size reflects attributed
            orders. Anything below the break-even line is losing money.
          </p>
        </div>

        <div className="mt-10 grid gap-8 lg:grid-cols-[2fr_1fr]">
          <div className="border p-4 md:p-6">
            <div className="flex gap-2">
              <div className="flex w-8 shrink-0 flex-col justify-between py-1 text-right font-sans text-[10px] text-muted-foreground">
                {[7, 6, 5, 4, 3, 2, 1, 0].map((t) => (
                  <span key={t}>{t}x</span>
                ))}
              </div>
              <div className="relative aspect-[4/3] min-w-0 flex-1 border-b border-l sm:aspect-[16/9]">
                <div
                  className="absolute inset-x-0 border-t border-dashed border-primary/60"
                  style={{ top: `${100 - (1 / maxRoas) * 100}%` }}
                >
                  <span className="absolute -top-5 right-1 text-[10px] text-primary dark:text-primary">
                    Break-even 1x
                  </span>
                </div>
                {campaigns.map((c) => {
                  const size = 14 + Math.sqrt(c.orders) * 0.7
                  const on = c.name === selected
                  return (
                    <button
                      key={c.name}
                      type="button"
                      onClick={() => setSelected(c.name)}
                      aria-label={c.name}
                      aria-pressed={on}
                      className={cn(
                        "absolute -translate-x-1/2 translate-y-1/2 rounded-full border-2 transition-all",
                        on ? "z-10 border-foreground opacity-100" : "border-background opacity-70 hover:opacity-100"
                      )}
                      style={{
                        left: `${(c.spend / maxSpend) * 100}%`,
                        bottom: `${(c.roas / maxRoas) * 100}%`,
                        width: size,
                        height: size,
                        background: channelColor[c.channel],
                      }}
                    />
                  )
                })}
              </div>
            </div>
            <div className="mt-2 ml-10 flex justify-between font-sans text-[10px] text-muted-foreground">
              {[0, 15, 30, 45].map((t) => (
                <span key={t}>${t}k</span>
              ))}
            </div>
            <p className="mt-1 text-center text-[10px] text-muted-foreground">Spend</p>
          </div>

          <div className="flex flex-col gap-6">
            <div className="border bg-muted/40 p-6">
              {active ? (
                <>
                  <p className="text-xs text-muted-foreground">{active.channel}</p>
                  <p className="mt-1 text-lg font-medium">{active.name}</p>
                  <dl className="mt-6 grid grid-cols-3 gap-4">
                    <div>
                      <dt className="text-[10px] text-muted-foreground uppercase">Spend</dt>
                      <dd className="mt-1 font-sans text-lg">${active.spend}k</dd>
                    </div>
                    <div>
                      <dt className="text-[10px] text-muted-foreground uppercase">ROAS</dt>
                      <dd className="mt-1 font-sans text-lg">{active.roas}x</dd>
                    </div>
                    <div>
                      <dt className="text-[10px] text-muted-foreground uppercase">Orders</dt>
                      <dd className="mt-1 font-sans text-lg">{active.orders.toLocaleString()}</dd>
                    </div>
                  </dl>
                </>
              ) : (
                <p className="text-sm text-muted-foreground">Select a bubble to inspect a campaign.</p>
              )}
            </div>
            <ul className="space-y-2 text-sm">
              {Object.entries(channelColor).map(([name, color]) => (
                <li key={name} className="flex items-center gap-3">
                  <span className="size-3 rounded-full" style={{ background: color }} />
                  <span className="flex-1">{name}</span>
                  <span className="font-sans text-xs text-muted-foreground">
                    {campaigns.filter((c) => c.channel === name).length} campaigns
                  </span>
                </li>
              ))}
            </ul>
          </div>
        </div>
      </div>
    </section>
  )
}
Clickable bubble scatter of campaign spend vs ROAS with a break-even line and a detail panel for the selected campaign.
analytics-16
Files
import {
  Check,
  Flag,
} from "@designali/icons"

import { cn } from "@/lib/utils"

import { CounterNumber } from "@/components/ui/counter-number"

const milestones = [
  { arr: 100, label: "100k downloads", date: "Feb 2025", note: "First Designali templates and Dalim UI kits shipped." },
  { arr: 500, label: "500k downloads", date: "Sep 2025", note: "@designali/icons published with 4,000+ icons." },
  { arr: 1000, label: "1M downloads", date: "Mar 2026", note: "460+ blocks and 240+ landing pages live on designali.com." },
  { arr: 2500, label: "2.5M downloads", date: "Oct 2026", note: "2,300+ UI examples added to /ui." },
  { arr: 5000, label: "5M downloads", date: "Target Q3 2027", note: "More templates, logos and vectors for design engineers." },
]

const currentArr = 2870
const goal = 5000

export function Analytics17() {
  const progress = (currentArr / goal) * 100

  return (
    <section className="w-full bg-background py-16 text-foreground md:py-24">
      <div className="mx-auto max-w-7xl px-6">
        <div className="flex flex-col gap-6 md:flex-row md:items-end md:justify-between">
          <div>
            <p className="text-xs tracking-widest text-muted-foreground uppercase">
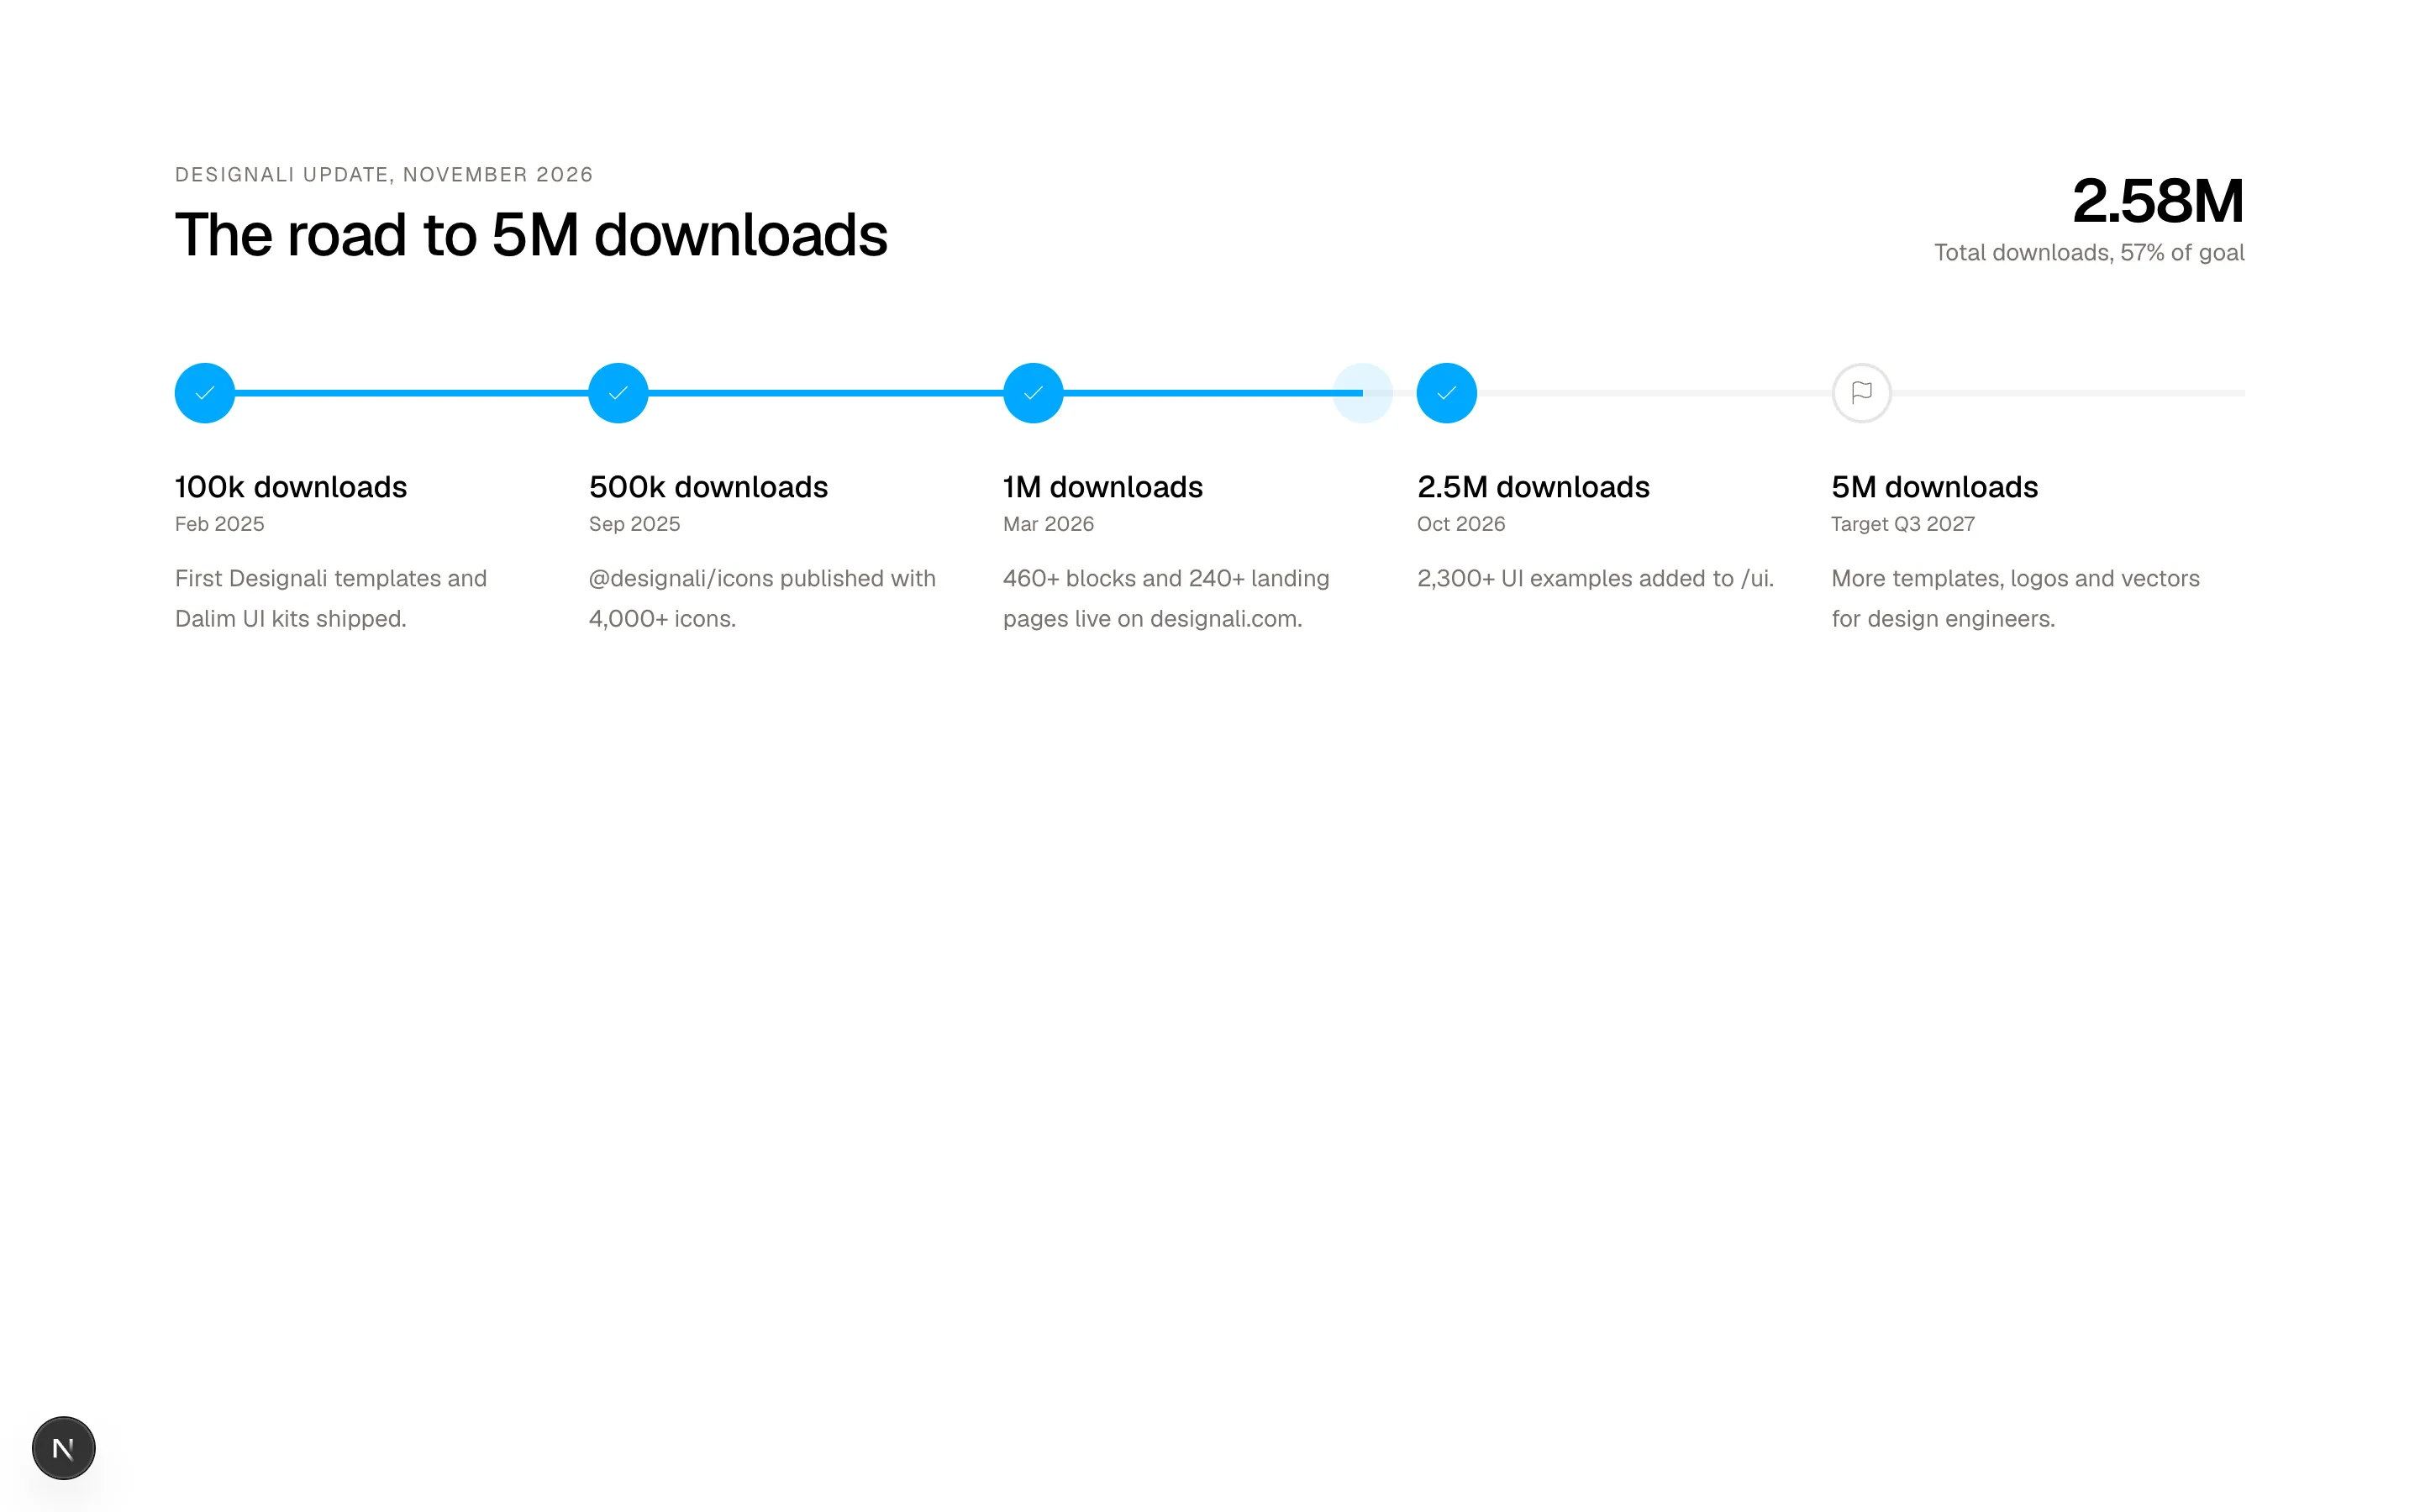
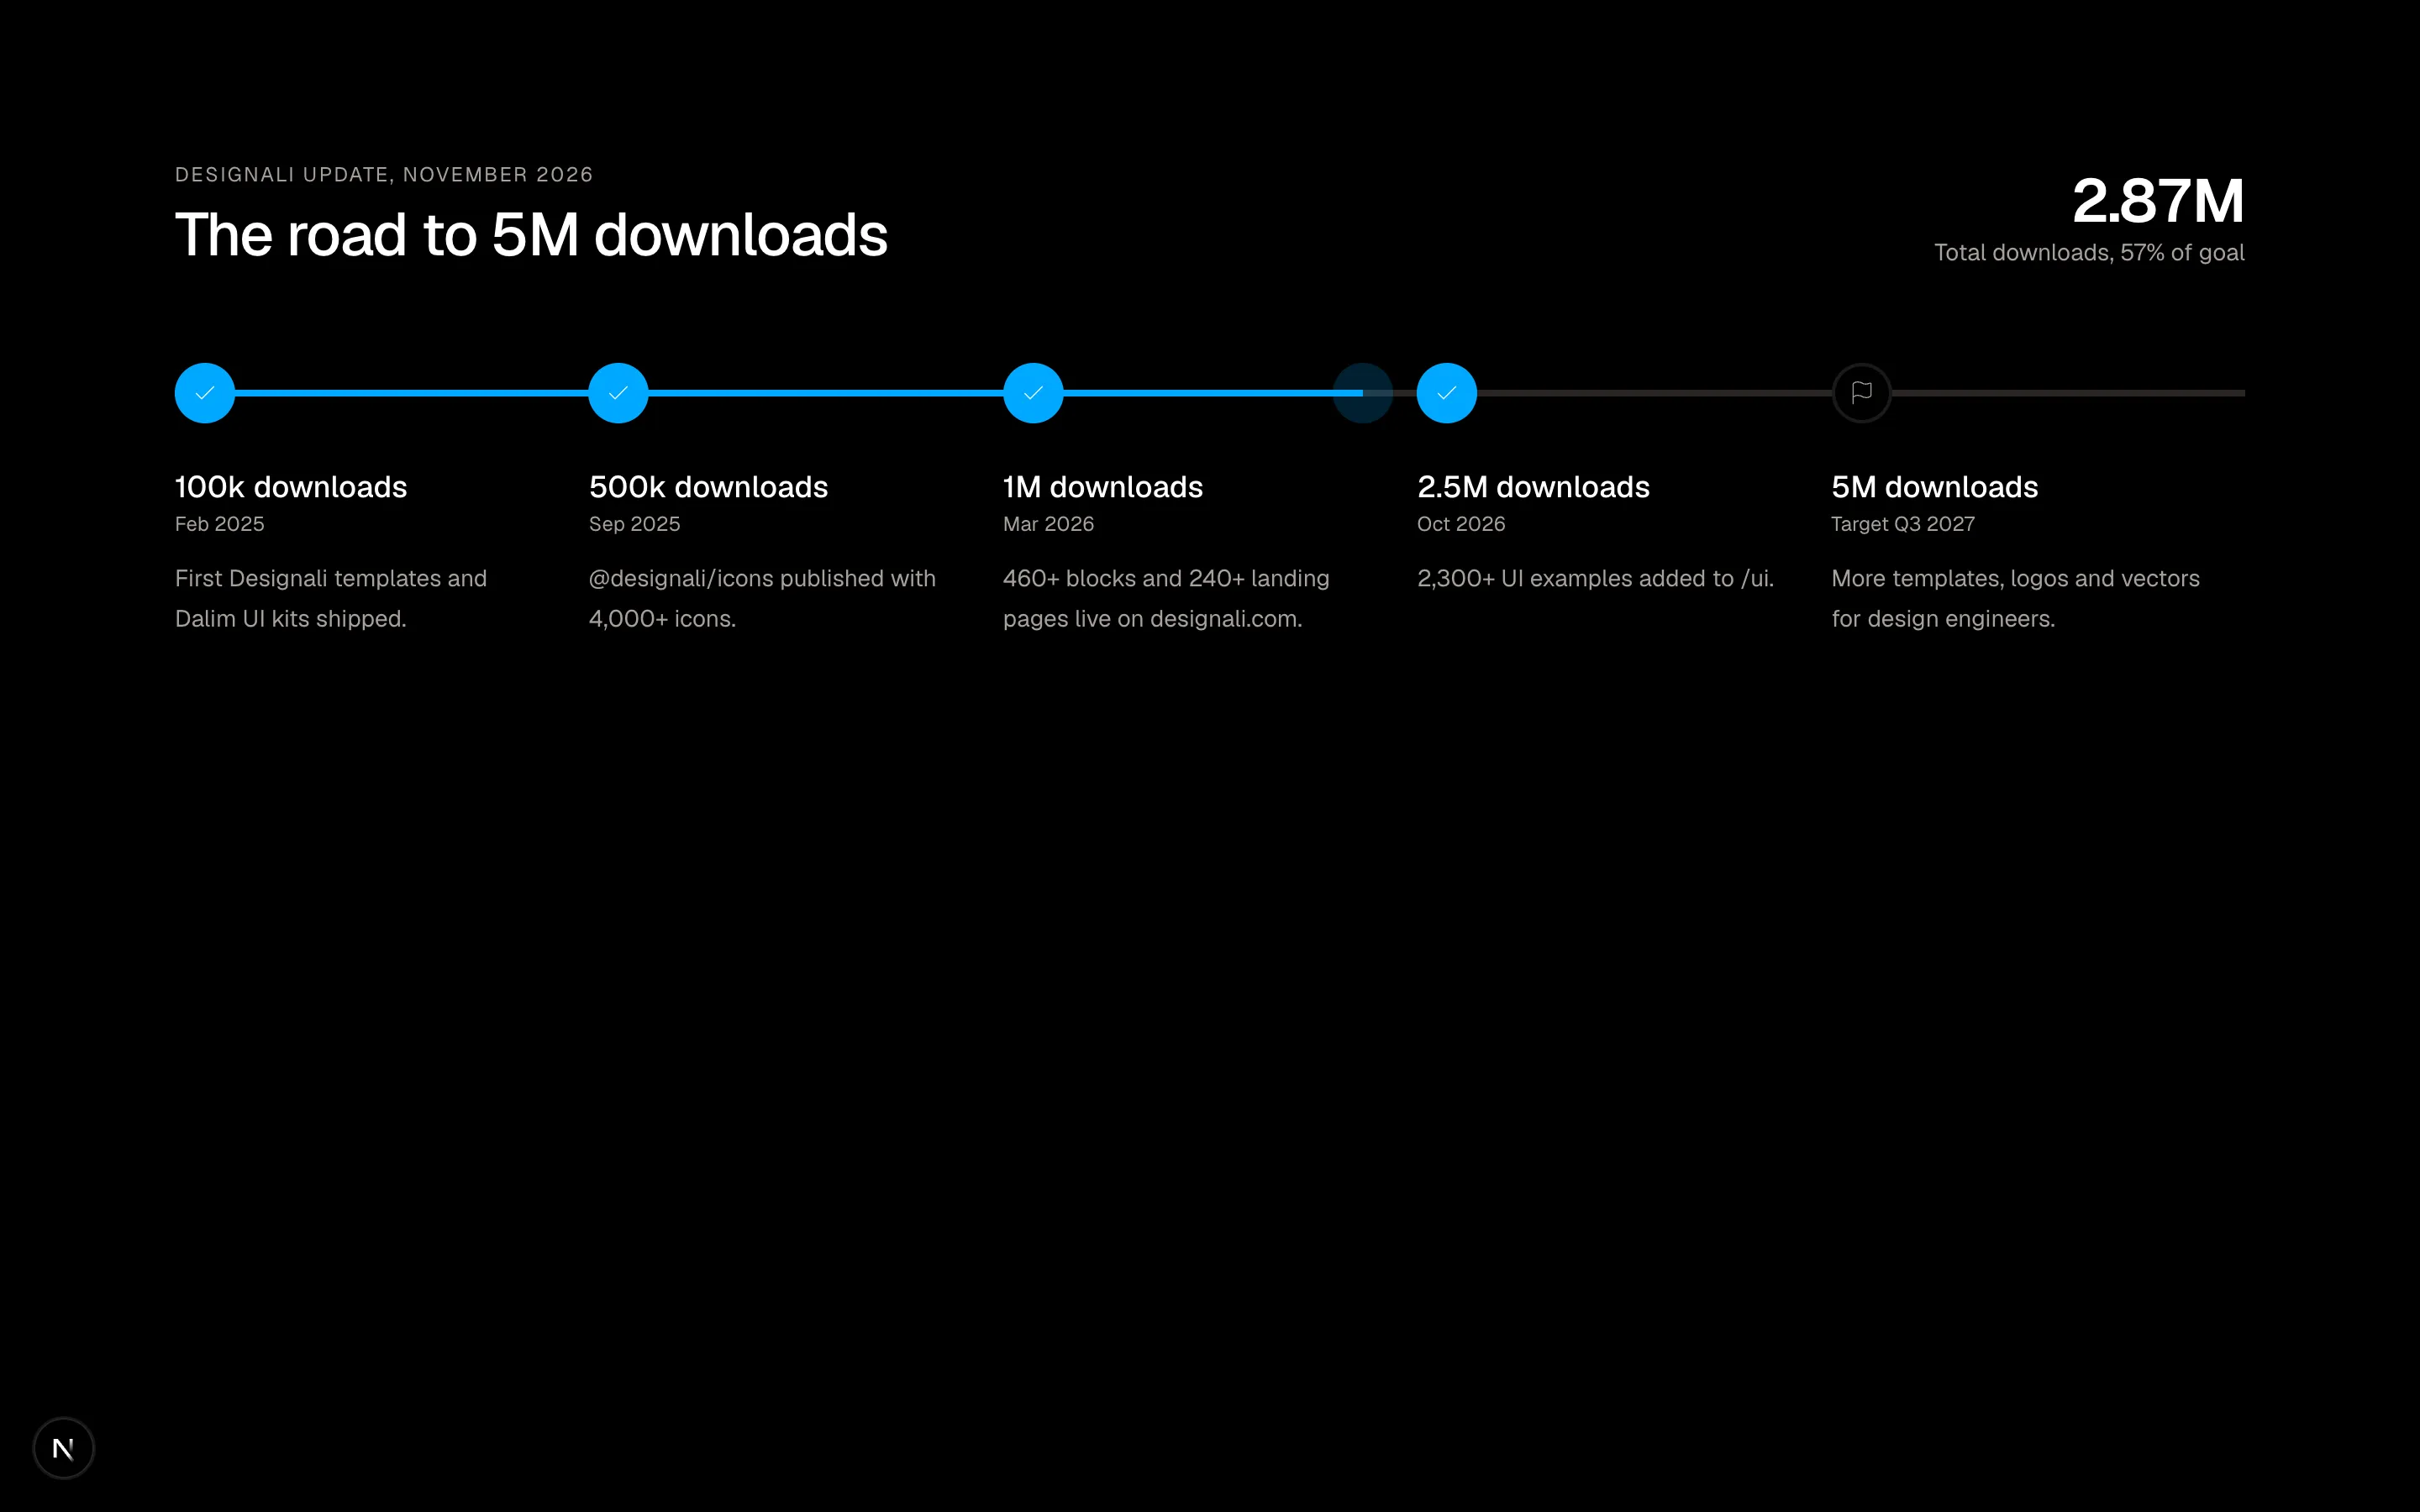
              Designali update, November 2026
            </p>
            <h2 className="mt-2 text-3xl font-medium tracking-tight md:text-4xl">
              The road to 5M downloads
            </h2>
          </div>
          <div className="text-left md:text-right">
            <CounterNumber
              value={currentArr / 1000}
              decimalPlaces={2}
              suffix="M"
              className="block text-4xl font-semibold tracking-tight"
            />
            <p className="text-sm text-muted-foreground">Total downloads, {progress.toFixed(0)}% of goal</p>
          </div>
        </div>

        <div className="relative mt-14 hidden md:block">
          <div className="absolute top-4 right-0 left-0 h-1 bg-muted" />
          <div className="absolute top-4 left-0 h-1 bg-primary" style={{ width: `${progress}%` }} />
          <div
            className="absolute top-0 -translate-x-1/2"
            style={{ left: `${progress}%` }}
          >
            <span className="block size-9 animate-pulse rounded-full bg-primary/20" />
          </div>
          <ol className="relative grid grid-cols-5">
            {milestones.map((m) => {
              const done = m.arr <= currentArr
              return (
                <li key={m.label} className="pr-6">
                  <span
                    className={cn(
                      "flex size-9 items-center justify-center rounded-full border-2",
                      done
                        ? "border-primary bg-primary text-primary-foreground"
                        : "border-border bg-background text-muted-foreground"
                    )}
                  >
                    {done ? <Check className="size-4" /> : <Flag className="size-4" />}
                  </span>
                  <p className="mt-6 text-lg font-medium">{m.label}</p>
                  <p className="text-xs text-muted-foreground">{m.date}</p>
                  <p className="mt-3 text-sm leading-6 text-muted-foreground">{m.note}</p>
                </li>
              )
            })}
          </ol>
        </div>

        <ol className="mt-10 space-y-0 border-l-2 md:hidden">
          {milestones.map((m) => {
            const done = m.arr <= currentArr
            return (
              <li key={m.label} className="relative pb-8 pl-8 last:pb-0">
                <span
                  className={cn(
                    "absolute top-0 -left-[13px] flex size-6 items-center justify-center rounded-full border-2",
                    done
                      ? "border-primary bg-primary text-primary-foreground"
                      : "border-border bg-background text-muted-foreground"
                  )}
                >
                  {done ? <Check className="size-3" /> : <Flag className="size-3" />}
                </span>
                <p className="font-medium">{m.label}</p>
                <p className="text-xs text-muted-foreground">{m.date}</p>
                <p className="mt-2 text-sm text-muted-foreground">{m.note}</p>
              </li>
            )
          })}
        </ol>
      </div>
    </section>
  )
}
Investor-style milestone timeline toward an ARR goal with a horizontal progress track on desktop and vertical list on mobile.
analytics-17
Files
import {
  ArrowUpRight,
  Clock,
  Users,
  Zap,
} from "@designali/icons"

import { BentoGrid, BentoGridItem } from "@/components/ui/bento"
import { CounterNumber } from "@/components/ui/counter-number"

const hourly = [12, 9, 7, 6, 8, 14, 26, 41, 58, 64, 61, 57, 60, 63, 66, 62, 55, 48, 40, 34, 29, 24, 19, 15]

const plans = [
  { name: "Free", value: 54, color: "var(--chart-1)" },
  { name: "Pro", value: 31, color: "var(--chart-2)" },
  { name: "Studio", value: 15, color: "var(--chart-3)" },
]

const features = [
  { name: "Blocks library", usage: 88 },
  { name: "Icons search", usage: 71 },
  { name: "Templates", usage: 46 },
  { name: "UI kits", usage: 23 },
]

export function Analytics18() {
  const maxHour = Math.max(...hourly)
  const r = 34
  const circ = 2 * Math.PI * r
  const arcs = plans.map((p, i) => ({
    ...p,
    len: (p.value / 100) * circ,
    offset: plans.slice(0, i).reduce((sum, q) => sum + (q.value / 100) * circ, 0),
  }))

  return (
    <section className="w-full bg-muted/40 py-16 text-foreground md:py-24">
      <div className="mx-auto max-w-7xl px-6">
        <h2 className="text-2xl font-medium tracking-tight md:text-3xl">designali.com health</h2>
        <p className="mt-1 text-sm text-muted-foreground">designali.com, all members, today</p>

        <BentoGrid
          cols={{ base: 1, md: 4 }}
          gap={{ base: 4 }}
          rowHeight="minmax(160px,auto)"
          className="mt-8"
        >
          <BentoGridItem
            colSpan={{ base: 1, md: 2 }}
            rowSpan={{ base: 1, md: 2 }}
            className="flex flex-col justify-between border-0 bg-primary p-6 text-primary-foreground"
          >
            <div className="flex items-center justify-between">
              <p className="text-sm opacity-80">Daily active users</p>
              <Users className="size-4 opacity-80" />
            </div>
            <div>
              <CounterNumber
                value={48215}
                className="block text-6xl font-light tracking-tighter text-primary-foreground md:text-7xl"
              />
              <p className="mt-3 inline-flex items-center gap-1 text-sm opacity-80">
                <ArrowUpRight className="size-4" />
                12.8% vs. last Tuesday
              </p>
            </div>
            <div className="mt-6 flex h-20 items-end gap-[3px]">
              {hourly.map((v, i) => (
                <div
                  key={i}
                  className="flex-1 bg-primary-foreground/30 last:bg-primary-foreground"
                  style={{ height: `${(v / maxHour) * 100}%` }}
                />
              ))}
            </div>
          </BentoGridItem>

          <BentoGridItem className="flex flex-col justify-between p-6">
            <div className="flex items-center justify-between text-sm text-muted-foreground">
              Median session
              <Clock className="size-4" />
            </div>
            <p className="text-4xl font-semibold tracking-tight">
              14<span className="text-lg text-muted-foreground">m</span> 32
              <span className="text-lg text-muted-foreground">s</span>
            </p>
          </BentoGridItem>

          <BentoGridItem className="flex flex-col justify-between p-6">
            <div className="flex items-center justify-between text-sm text-muted-foreground">
              Blocks copied
              <Zap className="size-4" />
            </div>
            <CounterNumber
              value={1.2}
              decimalPlaces={1}
              suffix="M"
              className="block text-4xl font-semibold tracking-tight"
            />
          </BentoGridItem>

          <BentoGridItem
            colSpan={{ base: 1, md: 2 }}
            className="flex items-center gap-6 p-6"
          >
            <svg viewBox="0 0 100 100" className="size-28 shrink-0 -rotate-90">
              {arcs.map((p) => (
                <circle
                  key={p.name}
                  cx="50"
                  cy="50"
                  r={r}
                  fill="none"
                  stroke={p.color}
                  strokeWidth="14"
                  strokeDasharray={`${p.len} ${circ - p.len}`}
                  strokeDashoffset={-p.offset}
                />
              ))}
            </svg>
            <div className="min-w-0 flex-1">
              <p className="text-sm text-muted-foreground">Active users by plan</p>
              <ul className="mt-3 space-y-2 text-sm">
                {plans.map((p) => (
                  <li key={p.name} className="flex items-center gap-2">
                    <span className="size-2.5" style={{ background: p.color }} />
                    <span className="flex-1">{p.name}</span>
                    <span className="font-sans text-xs">{p.value}%</span>
                  </li>
                ))}
              </ul>
            </div>
          </BentoGridItem>

          <BentoGridItem colSpan={{ base: 1, md: 4 }} className="p-6">
            <p className="text-sm text-muted-foreground">Feature adoption (weekly active)</p>
            <div className="mt-5 grid gap-5 sm:grid-cols-2 lg:grid-cols-4">
              {features.map((f) => (
                <div key={f.name}>
                  <div className="flex items-baseline justify-between">
                    <span className="text-sm">{f.name}</span>
                    <span className="font-sans text-xs text-muted-foreground">{f.usage}%</span>
                  </div>
                  <div className="mt-2 grid grid-cols-10 gap-1">
                    {Array.from({ length: 10 }, (_, i) => (
                      <span
                        key={i}
                        className={i < Math.round(f.usage / 10) ? "h-2 bg-foreground" : "h-2 bg-muted"}
                      />
                    ))}
                  </div>
                </div>
              ))}
            </div>
          </BentoGridItem>
        </BentoGrid>
      </div>
    </section>
  )
}
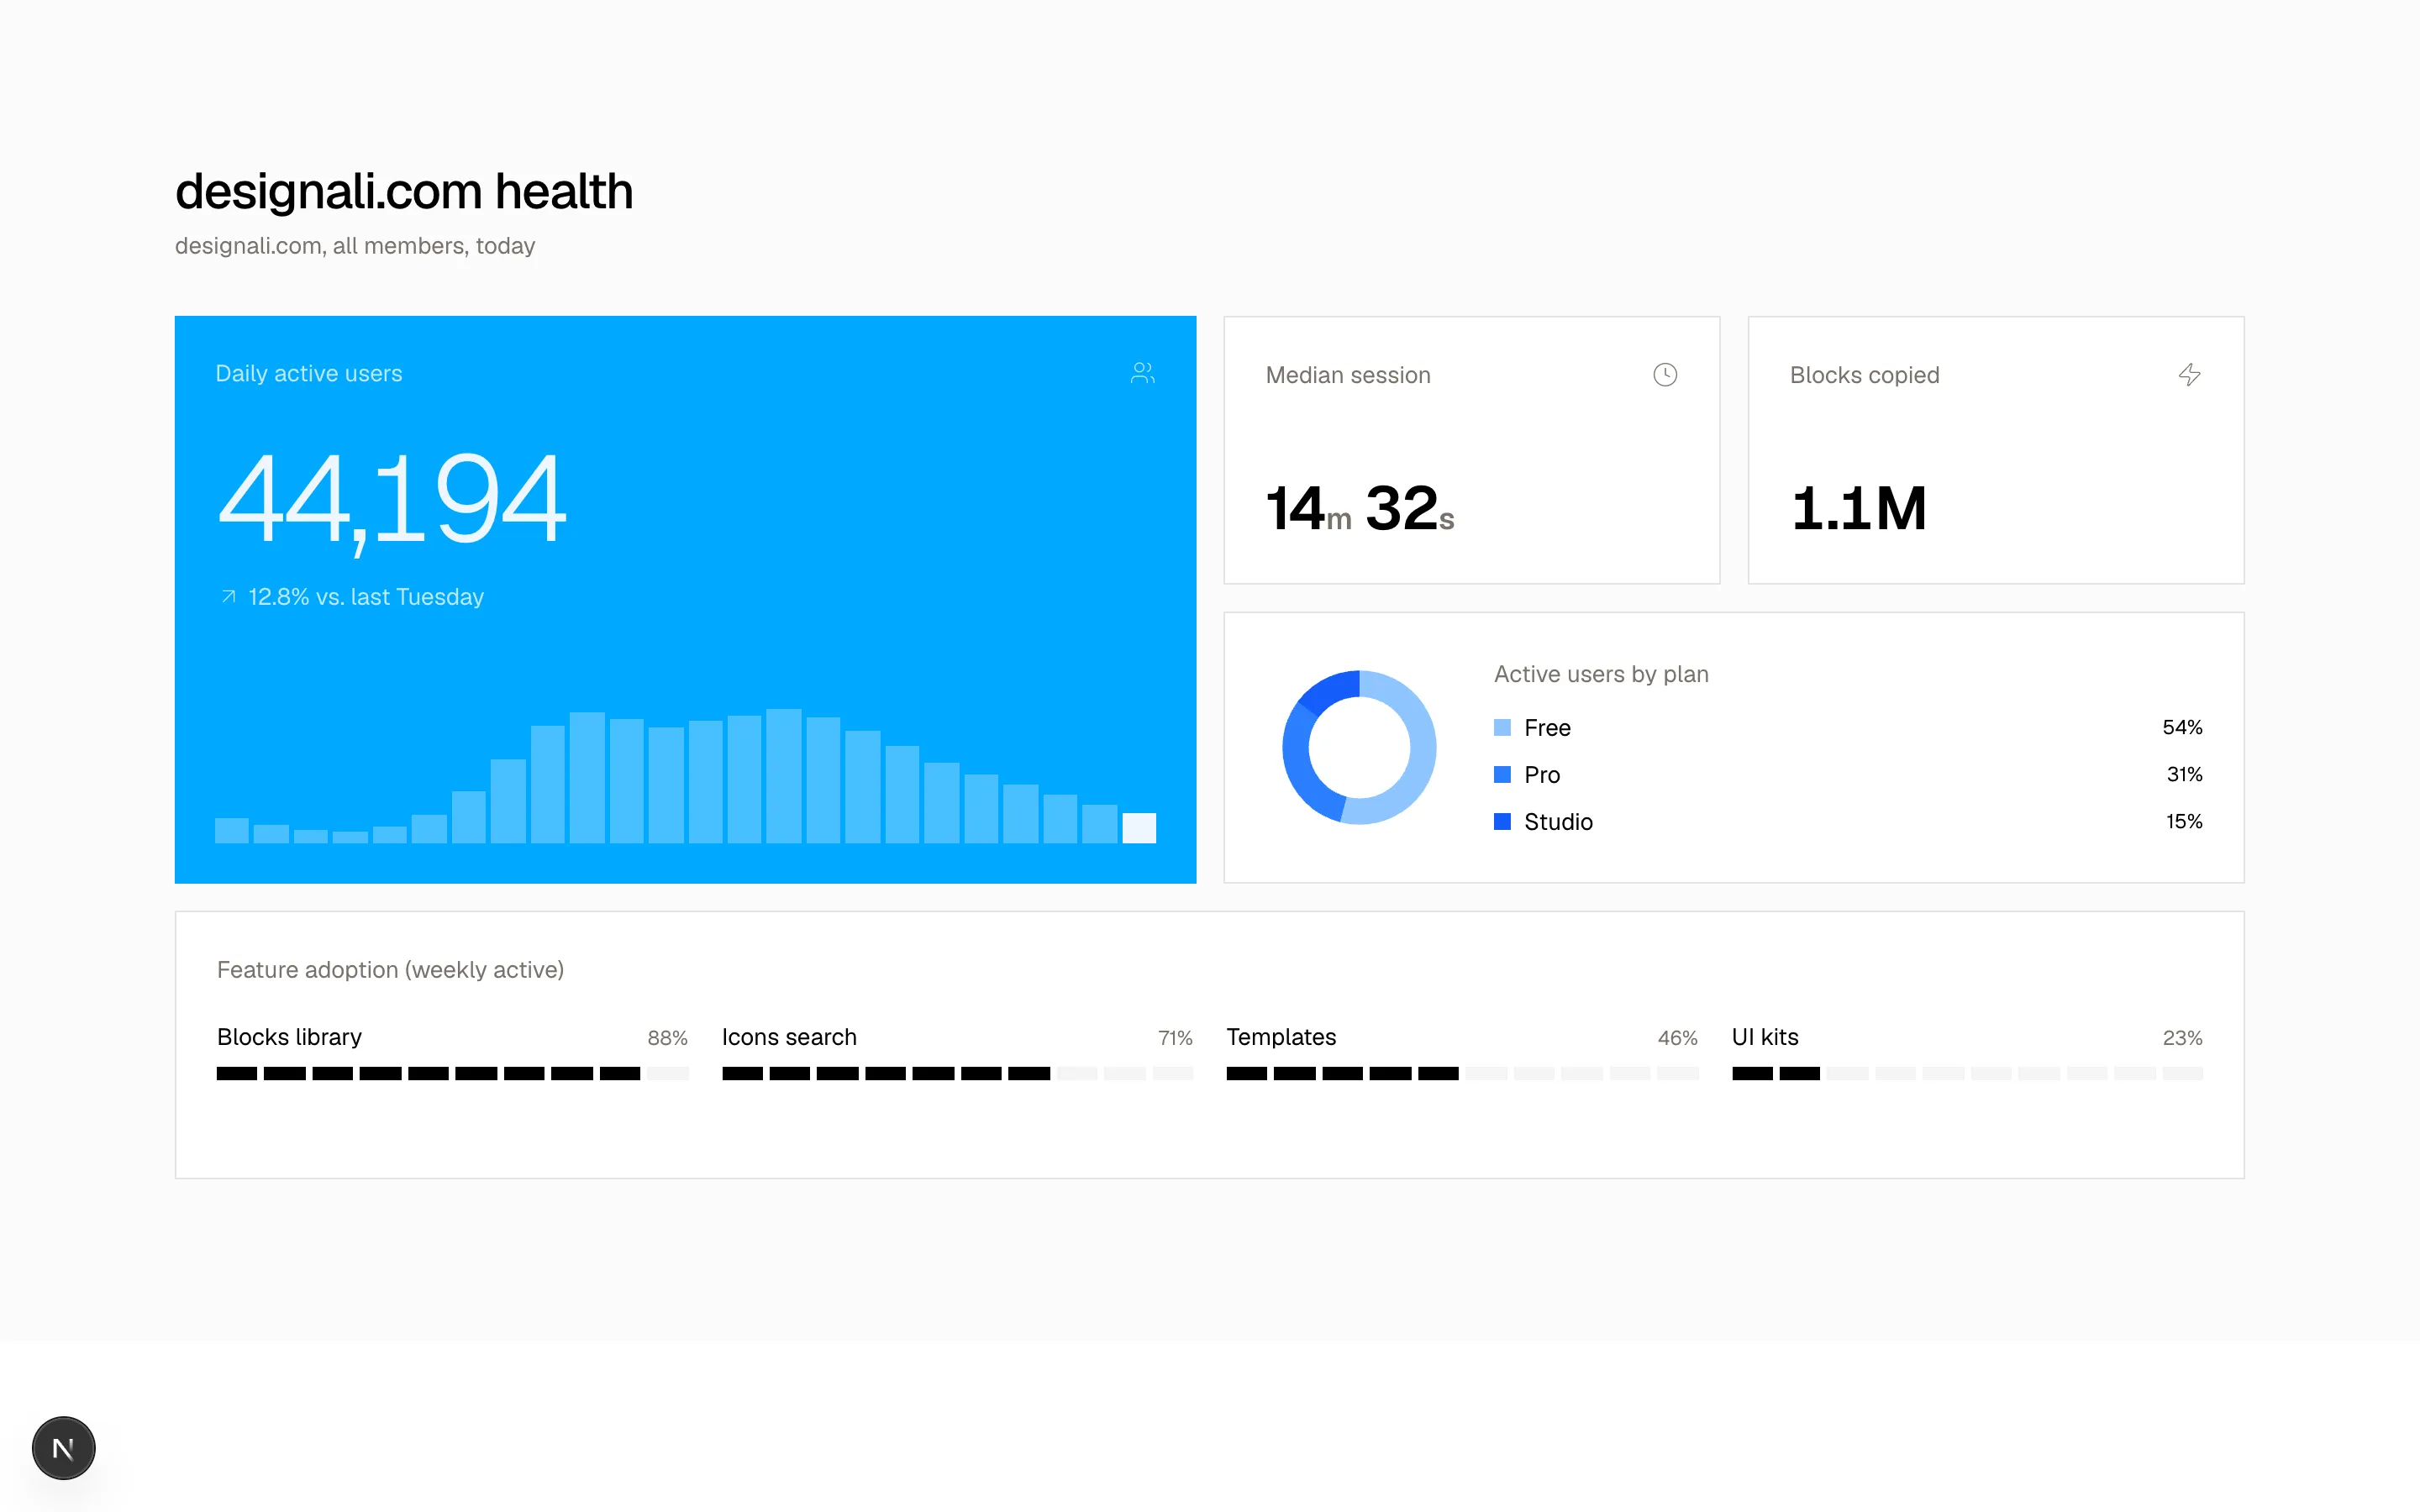
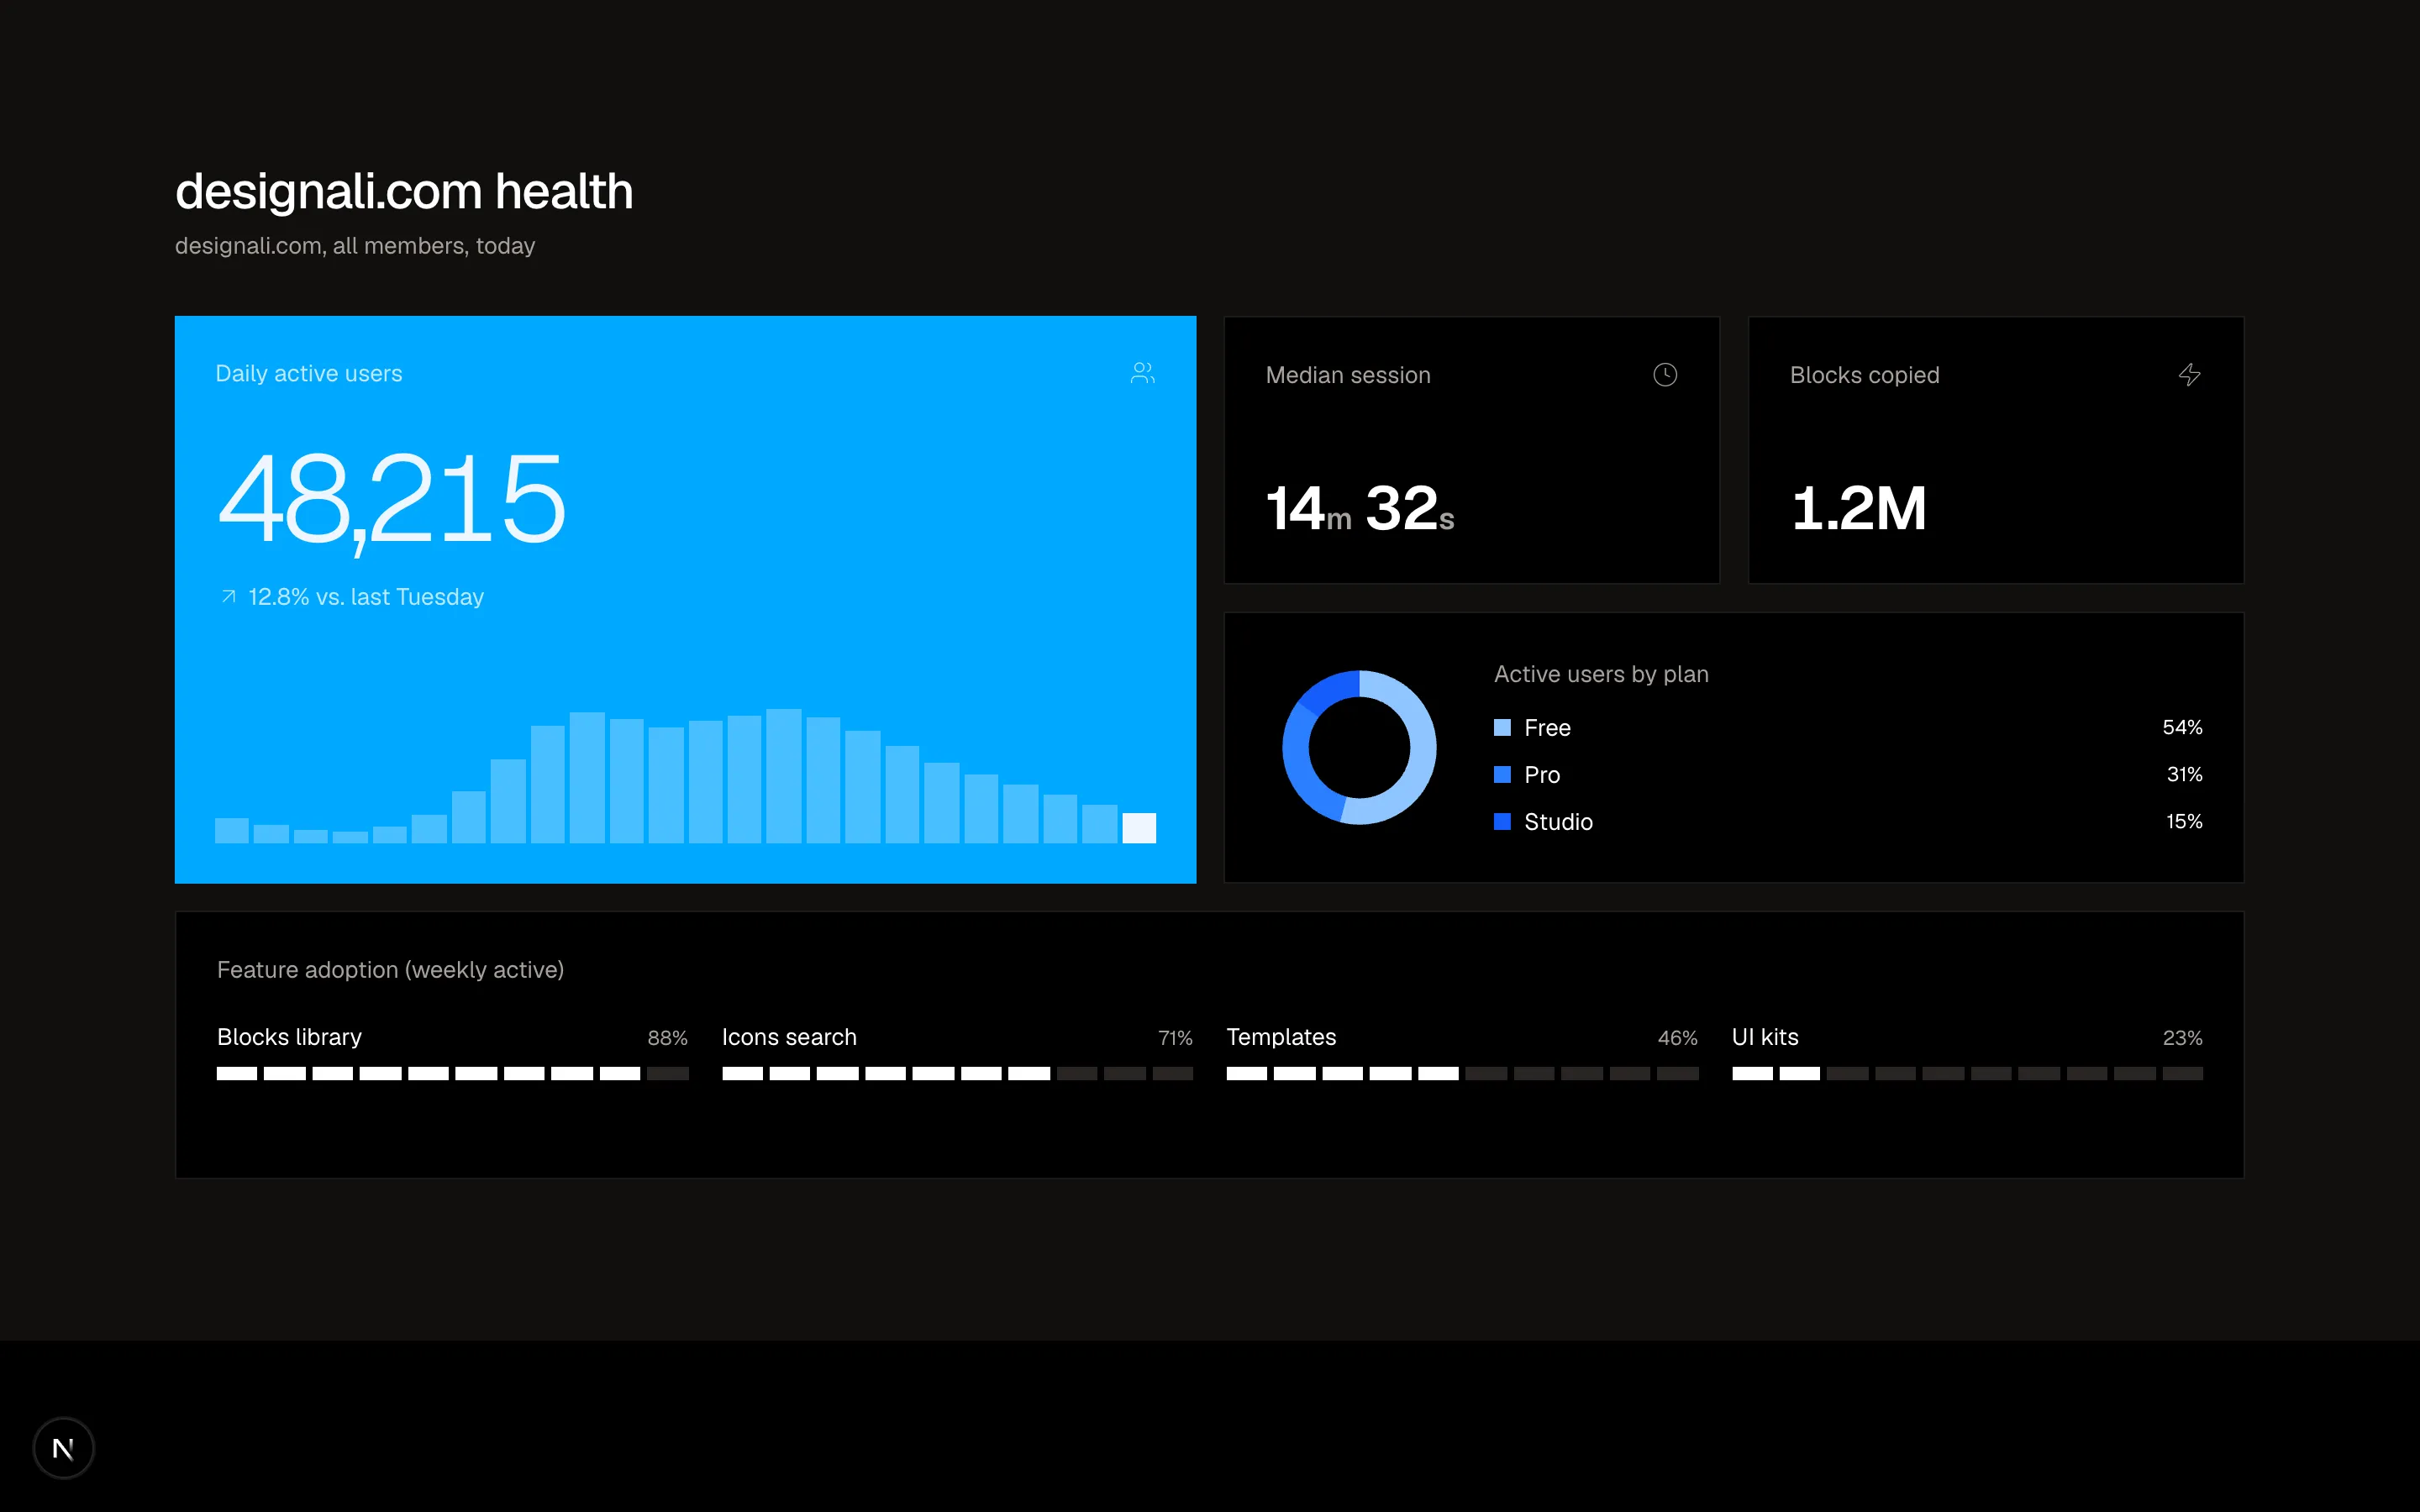
Bento dashboard with a primary DAU hero tile, small stat tiles, a plan donut and segmented feature adoption meters.
analytics-18
Files
"use client"

import { useMemo, useState } from "react"
import {
  ArrowDown,
  ArrowUp,
  ChevronsUpDown,
} from "@designali/icons"

import { cn } from "@/lib/utils"

type Row = {
  name: string
  owner: string
  installs: number
  rating: number
  revenue: number
  trend: number[]
}

const rows: Row[] = [
  { name: "Portfolio Simple", owner: "Designali", installs: 18420, rating: 4.8, revenue: 42300, trend: [4, 5, 5, 6, 7, 8, 9] },
  { name: "Design Agency", owner: "Designali", installs: 12980, rating: 4.6, revenue: 31750, trend: [6, 6, 7, 6, 7, 7, 8] },
  { name: "Resort", owner: "Designali", installs: 9340, rating: 4.9, revenue: 58900, trend: [3, 4, 4, 5, 6, 6, 7] },
  { name: "Designali Icons", owner: "Designali", installs: 21760, rating: 4.2, revenue: 19400, trend: [9, 8, 8, 7, 7, 6, 6] },
  { name: "Dalim UI", owner: "Ali Imam", installs: 6210, rating: 4.7, revenue: 12800, trend: [2, 2, 3, 3, 4, 5, 6] },
  { name: "AI Template", owner: "Designali", installs: 15530, rating: 4.4, revenue: 37600, trend: [5, 6, 6, 6, 7, 6, 7] },
]

type SortKey = "installs" | "rating" | "revenue"

const columns: { key: SortKey; label: string }[] = [
  { key: "installs", label: "Installs" },
  { key: "rating", label: "Rating" },
  { key: "revenue", label: "Revenue" },
]

function Spark({ data }: { data: number[] }) {
  const max = Math.max(...data)
  const min = Math.min(...data)
  const up = (data[data.length - 1] ?? 0) >= (data[0] ?? 0)
  const pts = data
    .map((v, i) => `${(i / (data.length - 1)) * 60},${20 - ((v - min) / (max - min || 1)) * 16 - 2}`)
    .join(" ")
  return (
    <svg viewBox="0 0 60 20" className="h-5 w-16">
      <polyline
        points={pts}
        fill="none"
        strokeWidth="1.5"
        className={up ? "stroke-primary" : "stroke-primary"}
      />
    </svg>
  )
}

export function Analytics19() {
  const [sort, setSort] = useState<{ key: SortKey; dir: "asc" | "desc" }>({
    key: "revenue",
    dir: "desc",
  })

  const sorted = useMemo(
    () =>
      [...rows].sort((a, b) =>
        sort.dir === "asc" ? a[sort.key] - b[sort.key] : b[sort.key] - a[sort.key]
      ),
    [sort]
  )

  function toggle(key: SortKey) {
    setSort((prev) =>
      prev.key === key ? { key, dir: prev.dir === "asc" ? "desc" : "asc" } : { key, dir: "desc" }
    )
  }

  return (
    <section className="w-full bg-background py-16 text-foreground md:py-24">
      <div className="mx-auto max-w-7xl px-6">
        <div className="mb-8 flex flex-col gap-2 sm:flex-row sm:items-end sm:justify-between">
          <div>
            <h2 className="text-2xl font-medium tracking-tight md:text-3xl">Templates leaderboard</h2>
            <p className="mt-1 text-sm text-muted-foreground">
              Top Designali templates, last 30 days. Click a column to sort.
            </p>
          </div>
          <span className="text-xs text-muted-foreground">{rows.length} templates</span>
        </div>

        <div className="overflow-x-auto border">
          <table className="w-full min-w-[640px] text-sm">
            <thead className="border-b bg-muted/50 text-xs text-muted-foreground">
              <tr>
                <th className="w-12 px-4 py-3 text-left font-medium">#</th>
                <th className="px-4 py-3 text-left font-medium">Template</th>
                {columns.map((c) => {
                  const on = sort.key === c.key
                  return (
                    <th key={c.key} className="px-4 py-3 text-right font-medium">
                      <button
                        type="button"
                        onClick={() => toggle(c.key)}
                        className={cn(
                          "inline-flex items-center gap-1 hover:text-foreground",
                          on && "text-foreground"
                        )}
                      >
                        {c.label}
                        {on ? (
                          sort.dir === "asc" ? (
                            <ArrowUp className="size-3" />
                          ) : (
                            <ArrowDown className="size-3" />
                          )
                        ) : (
                          <ChevronsUpDown className="size-3" />
                        )}
                      </button>
                    </th>
                  )
                })}
                <th className="px-4 py-3 text-right font-medium">7-week trend</th>
              </tr>
            </thead>
            <tbody>
              {sorted.map((r, i) => (
                <tr key={r.name} className="border-b transition-colors last:border-b-0 hover:bg-muted/40">
                  <td className="px-4 py-4 font-sans text-xs text-muted-foreground">
                    {String(i + 1).padStart(2, "0")}
                  </td>
                  <td className="px-4 py-4">
                    <div className="flex items-center gap-3">
                      <span className="flex size-8 shrink-0 items-center justify-center bg-muted text-xs font-semibold">
                        {r.name.slice(0, 2).toUpperCase()}
                      </span>
                      <div>
                        <p className="font-medium">{r.name}</p>
                        <p className="text-xs text-muted-foreground">{r.owner}</p>
                      </div>
                    </div>
                  </td>
                  <td className="px-4 py-4 text-right font-sans">{r.installs.toLocaleString()}</td>
                  <td className="px-4 py-4 text-right font-sans">{r.rating.toFixed(1)}</td>
                  <td className="px-4 py-4 text-right font-sans">${r.revenue.toLocaleString()}</td>
                  <td className="px-4 py-4">
                    <div className="flex justify-end">
                      <Spark data={r.trend} />
                    </div>
                  </td>
                </tr>
              ))}
            </tbody>
          </table>
        </div>
      </div>
    </section>
  )
}
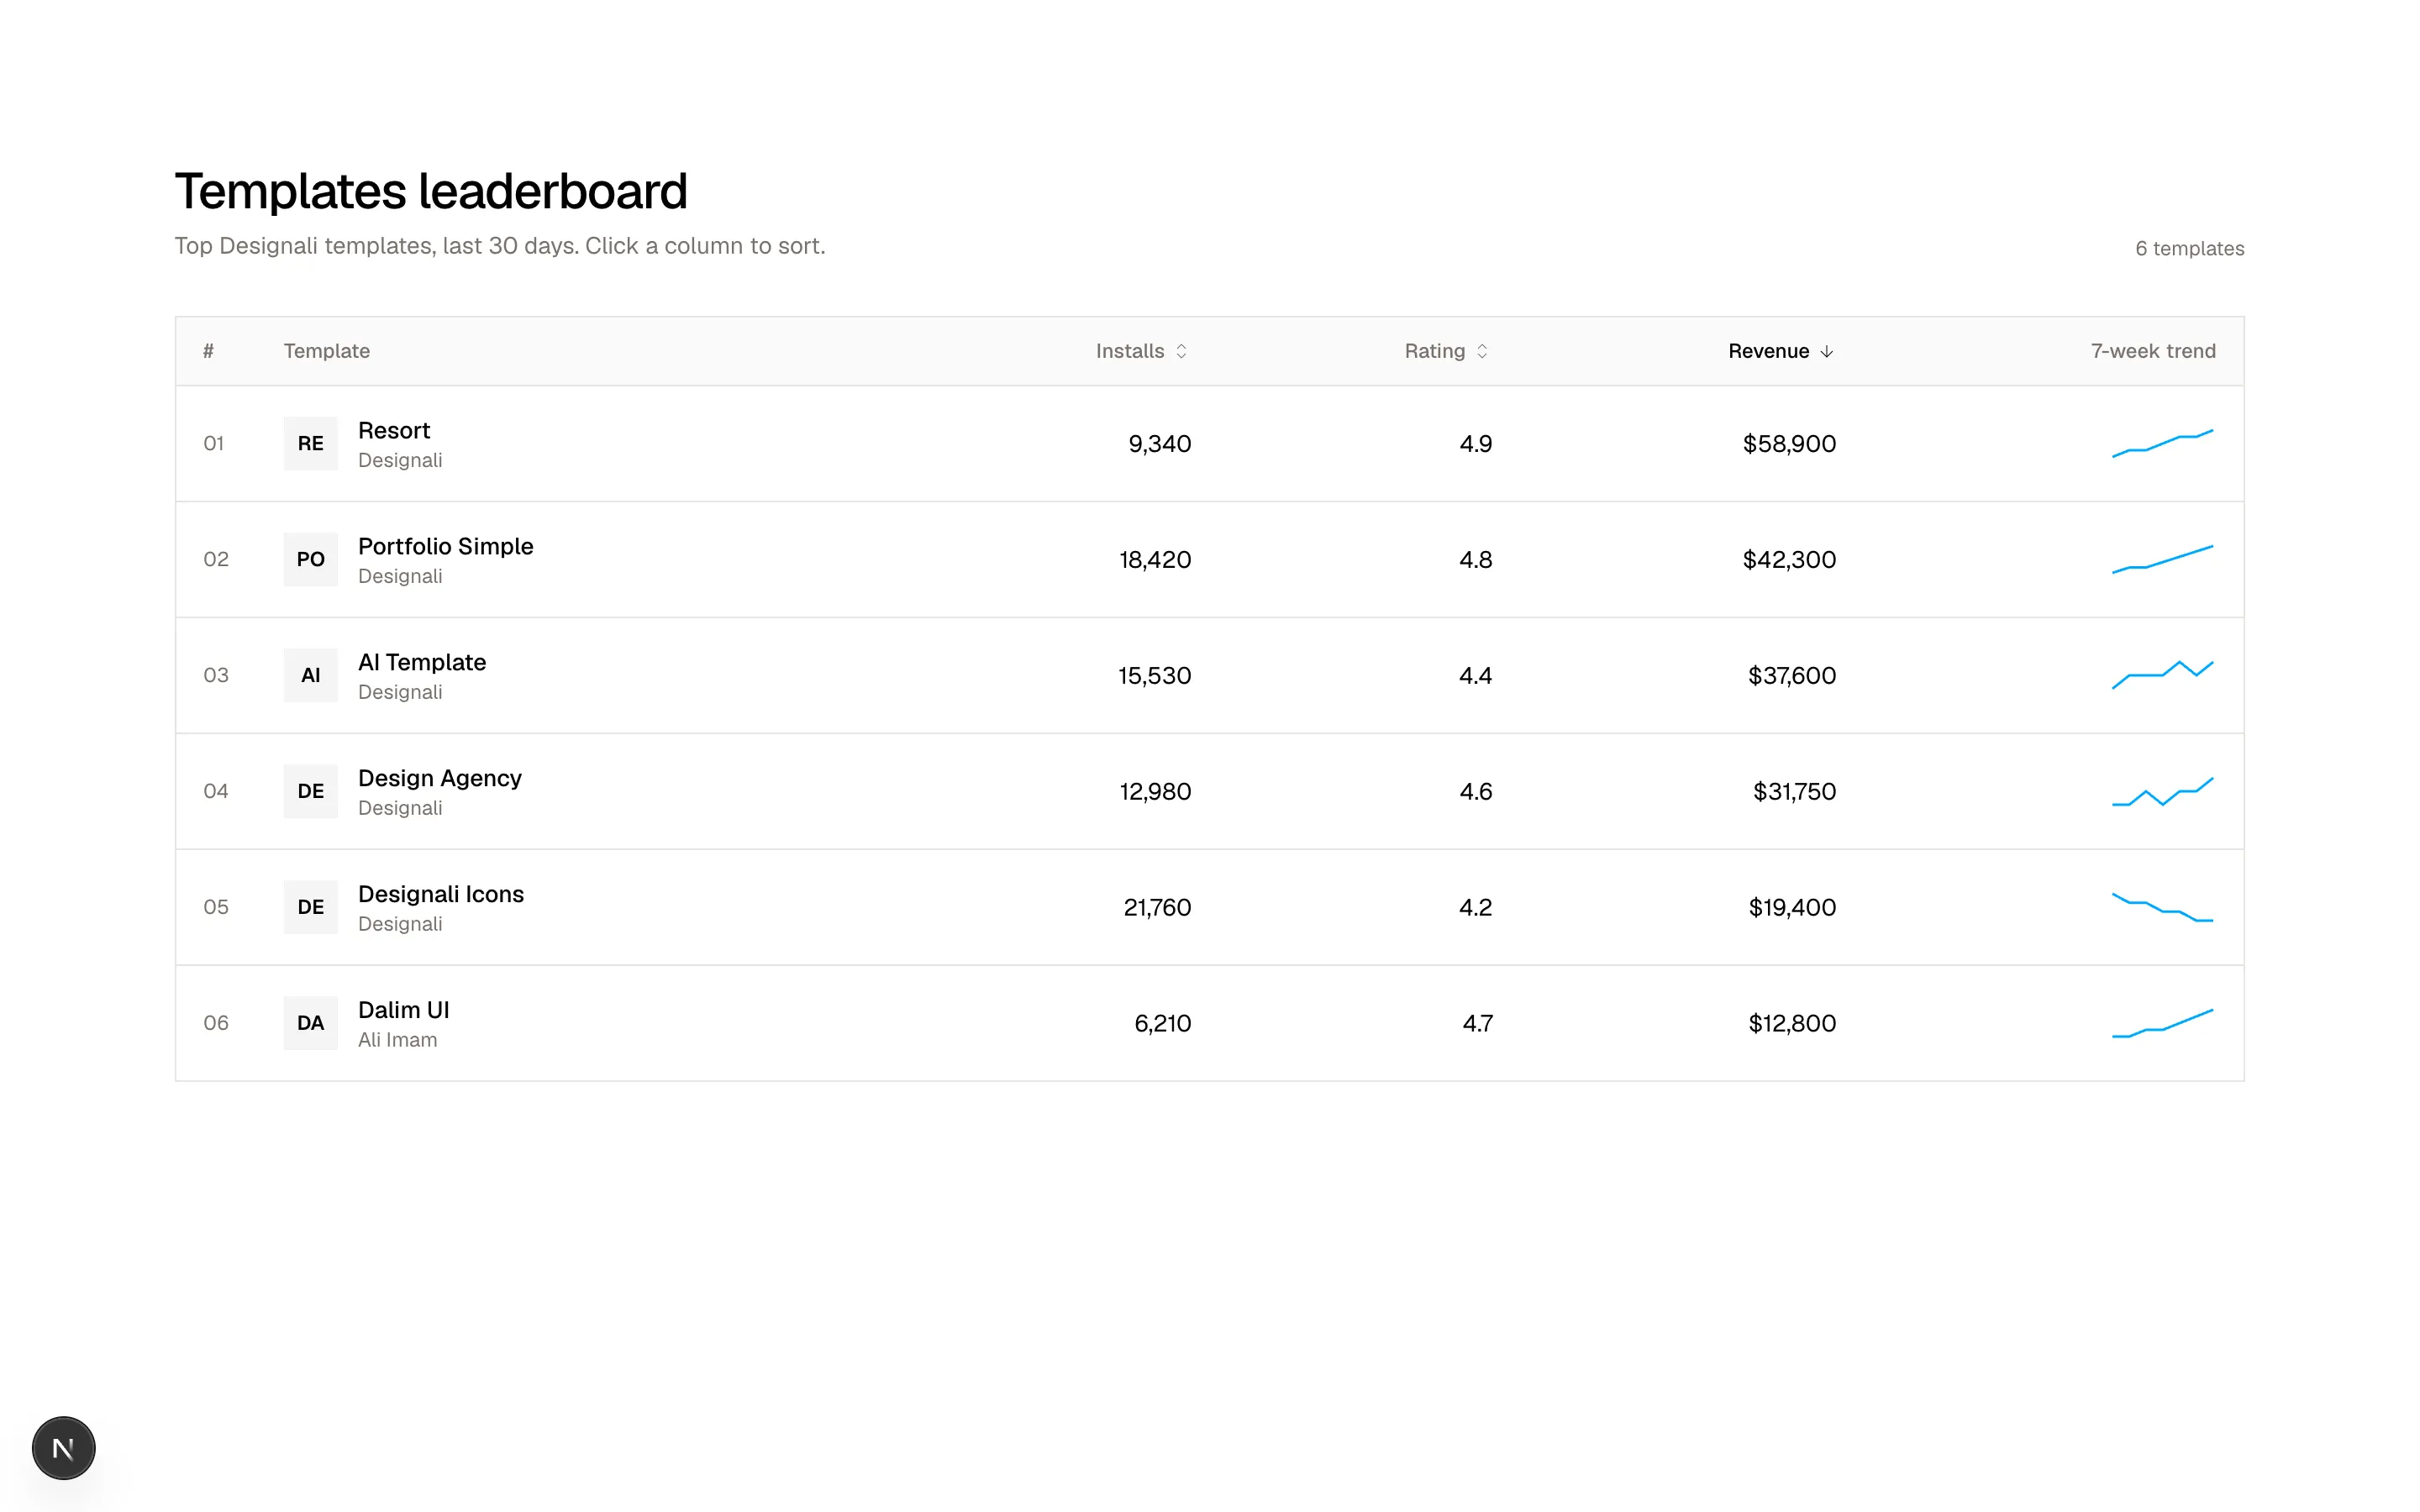
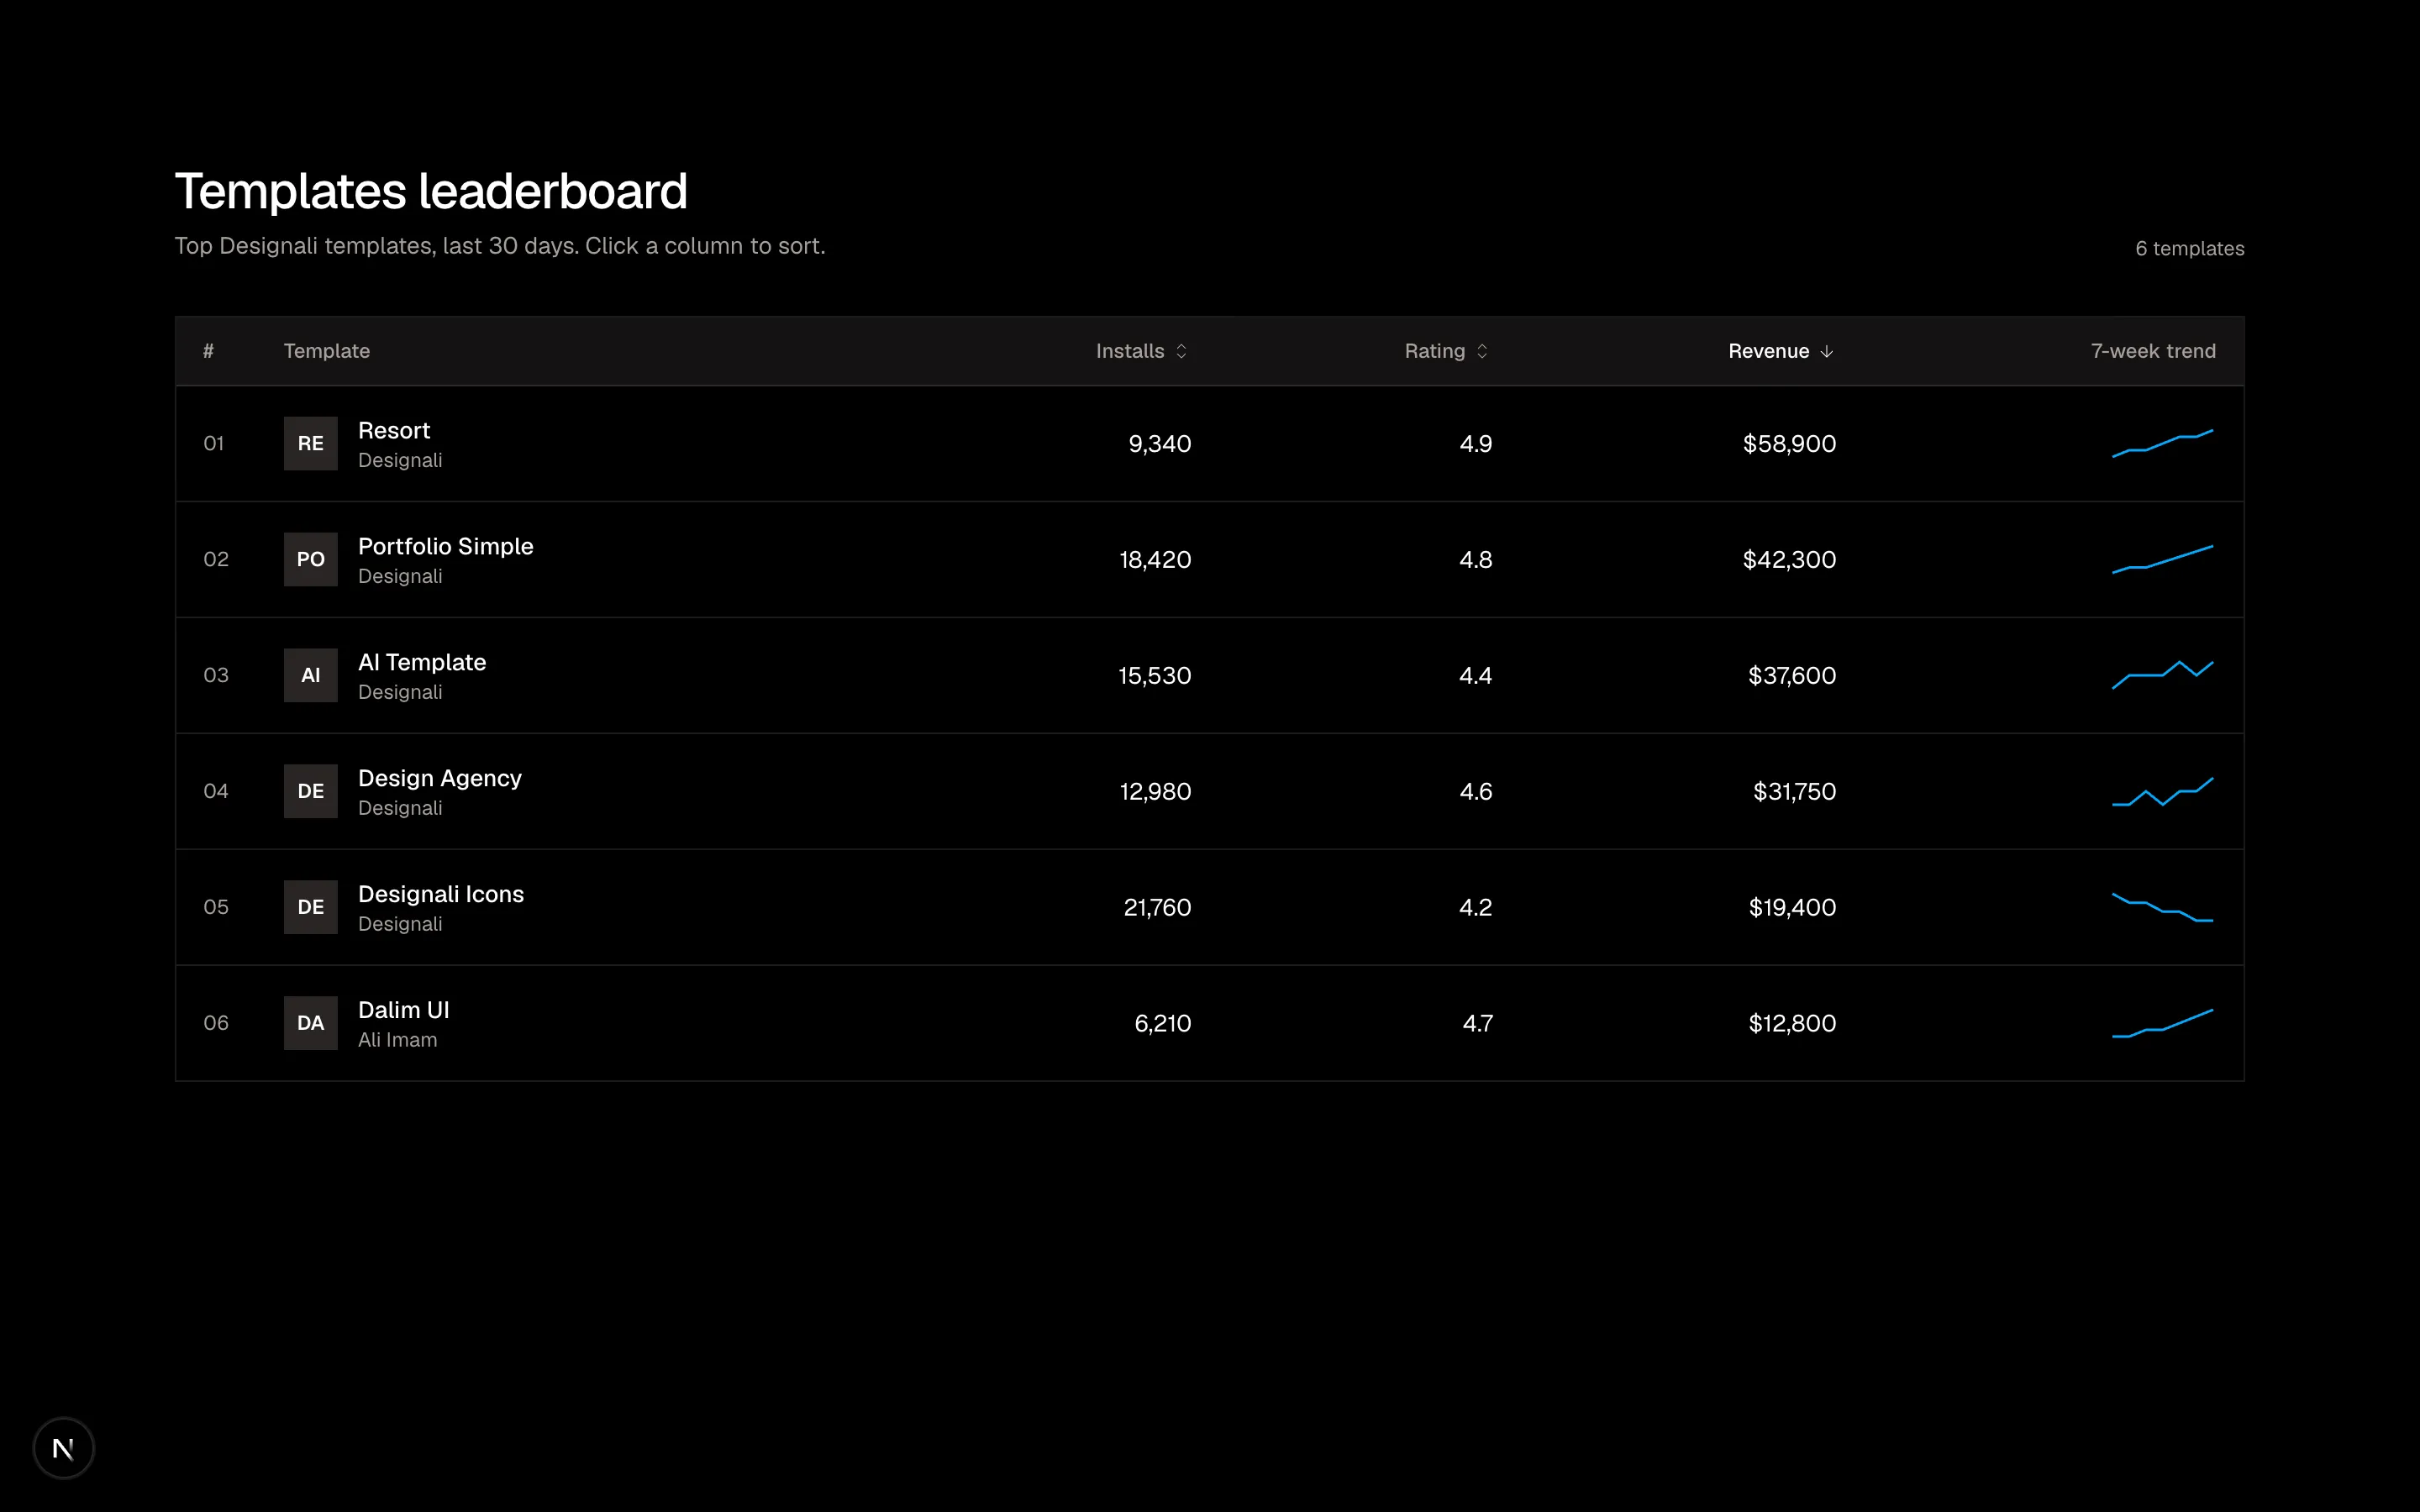
Sortable leaderboard table of marketplace apps with initials avatars, numeric columns and inline trend sparklines.
analytics-19
Files
import {
  ArrowRight,
  Sparkles,
} from "@designali/icons"

import { Button } from "@/components/ui/button"

import { CounterNumber } from "@/components/ui/counter-number"

const highlights = [
  { label: "Revenue", value: 212480, prefix: "$", suffix: "", decimals: 0, change: "+18%", good: true },
  { label: "Orders", value: 4906, prefix: "", suffix: "", decimals: 0, change: "+11%", good: true },
  { label: "Refund rate", value: 6.4, prefix: "", suffix: "%", decimals: 1, change: "+1.2 pts", good: false },
]

const movers = [
  { item: "Designali Icons Pro", note: "Top seller after Thursday launch", delta: "+214%" },
  { item: "Portfolio Simple template", note: "Featured in the Sunday newsletter", delta: "+96%" },
  { item: "Dalim UI kit", note: "Older kit, drop-off as expected", delta: "-38%" },
]

export function Analytics20() {
  return (
    <section className="w-full bg-background py-16 text-foreground md:py-24">
      <div className="mx-auto max-w-3xl px-6">
        <div className="border bg-card">
          <div className="flex items-center justify-between border-b px-6 py-4 md:px-10">
            <span className="inline-flex items-center gap-2 text-xs text-muted-foreground">
              <Sparkles className="size-3.5" />
              Weekly digest
            </span>
            <span className="text-xs text-muted-foreground">Nov 9 – Nov 15, 2026</span>
          </div>

          <div className="px-6 py-10 md:px-10">
            <h2 className="text-2xl leading-snug font-medium tracking-tight md:text-3xl">
              Your best week since launch, carried by one icon pack.
            </h2>
            <p className="mt-6 text-base leading-8 text-muted-foreground">
              designali.com sold{" "}
              <mark className="bg-primary/15 px-1 text-foreground dark:bg-primary/20">
                $212,480
              </mark>{" "}
              this week, up 18% on last week. Almost a third of that came from
              the{" "}
              <mark className="bg-chart-2/20 px-1 text-foreground">Designali Icons Pro</mark>,
              which launched on Thursday. Refunds ticked up to{" "}
              <mark className="bg-primary/15 px-1 text-foreground dark:bg-primary/20">6.4%</mark>,
              mostly duplicate license purchases.
            </p>

            <dl className="mt-10 grid grid-cols-1 gap-px border bg-border sm:grid-cols-3">
              {highlights.map((h) => (
                <div key={h.label} className="bg-card p-5">
                  <dt className="text-xs text-muted-foreground">{h.label}</dt>
                  <dd className="mt-2">
                    <CounterNumber
                      value={h.value}
                      prefix={h.prefix}
                      suffix={h.suffix}
                      decimalPlaces={h.decimals}
                      className="text-2xl font-semibold tracking-tight"
                    />
                  </dd>
                  <dd
                    className={
                      h.good
                        ? "mt-1 text-xs text-primary dark:text-primary"
                        : "mt-1 text-xs text-primary dark:text-primary"
                    }
                  >
                    {h.change} week over week
                  </dd>
                </div>
              ))}
            </dl>

            <h3 className="mt-12 text-xs tracking-widest text-muted-foreground uppercase">
              Biggest movers
            </h3>
            <ul className="mt-4 divide-y border-y">
              {movers.map((m) => (
                <li key={m.item} className="flex items-center justify-between gap-4 py-4">
                  <div className="min-w-0">
                    <p className="font-medium">{m.item}</p>
                    <p className="text-sm text-muted-foreground">{m.note}</p>
                  </div>
                  <span
                    className={
                      m.delta.startsWith("-")
                        ? "shrink-0 font-sans text-sm text-primary dark:text-primary"
                        : "shrink-0 font-sans text-sm text-primary dark:text-primary"
                    }
                  >
                    {m.delta}
                  </span>
                </li>
              ))}
            </ul>

            <div className="mt-10 flex flex-col gap-3 sm:flex-row">
              <Button nativeButton={false} render={<a href="#" />}>
                Open full report
                <ArrowRight data-icon="inline-end" />
              </Button>
              <Button variant="outline" nativeButton={false} render={<a href="#" />}>
                View icon pack
              </Button>
            </div>
          </div>
        </div>
      </div>
    </section>
  )
}
Email-style weekly digest card with a narrative summary using highlighted figures, stat row, biggest movers and CTAs.
analytics-20